Integrin αVβ3 targeted SPECT/CT for the assessment of Bevacizumab therapy in orthotopic lung cancer xenografts
2018.01.29.
Bin Chen et al, Oncology letters, 2018
Summary
The present study aimed to determine the utility of 99mTc-3PRGD2 SPECT/CT for the non-invasive monitoring of the response of integrin αvβ3 expression to anti-angiogenic treatment with bevacizumab. Bevacizumab or vehicle therapy was performed in athymic nu/nu mice bearing A549 lung tumors (moderately high integrin αvβ3 expression) or PC-3 prostate tumors (low integrin αvβ3 expression) at a dose of 1 mg twice a week. The average tumor volume was 180±90 mm3 the day prior to baseline SPECT/CT. Longitudinal 99mTc-3PRGD2 SPECT/CT imaging was performed at baseline (-1 day) and at days 5 and 15. Tumors were harvested at all imaging time points for histopathological analysis with hematoxylin and eosin (H&E) and immunohistochemistry staining. Results revealed a significant difference in tumor volume between vehicle- and bevacizumab-treated groups at 5 and 15 days following the start of treatment in the A549 lung model. At 5 days after the start of therapy, the percent injected dose per gram of tissue (%ID/g) and tumor-to-muscle ratio for bevacizumab-treated A549 declined persistently. However, for the vehicle-treated A549 model, the %ID and %ID/g value increased 5 days after the start of treatment. For the PC-3 model, slow-growing tumors and low tumor uptake was observed throughout the study. Alterations in tumor vasculature were confirmed by histopathological H&E analysis and immunohistochemistry. In conclusion, longitudinal imaging using 99mTc-3PRGD2 SPECT/CT may be a useful tool for monitoring the anti-angiogenic effect of bevacizumab therapy.
Results from nanoScan® SPECT/CT
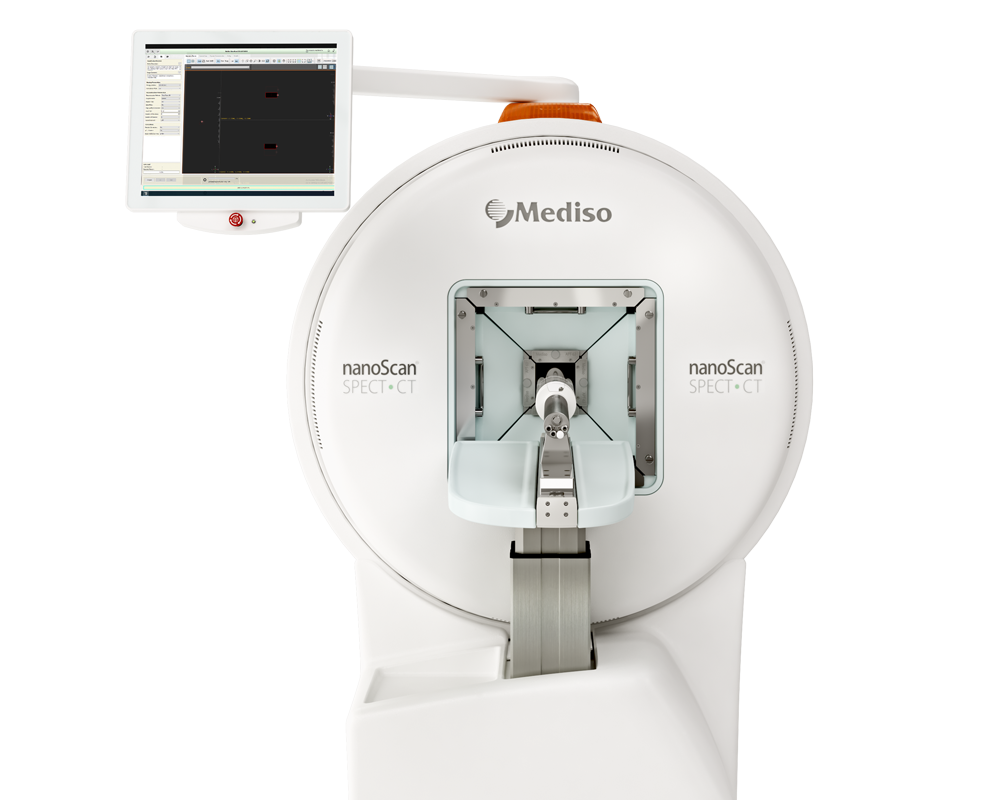
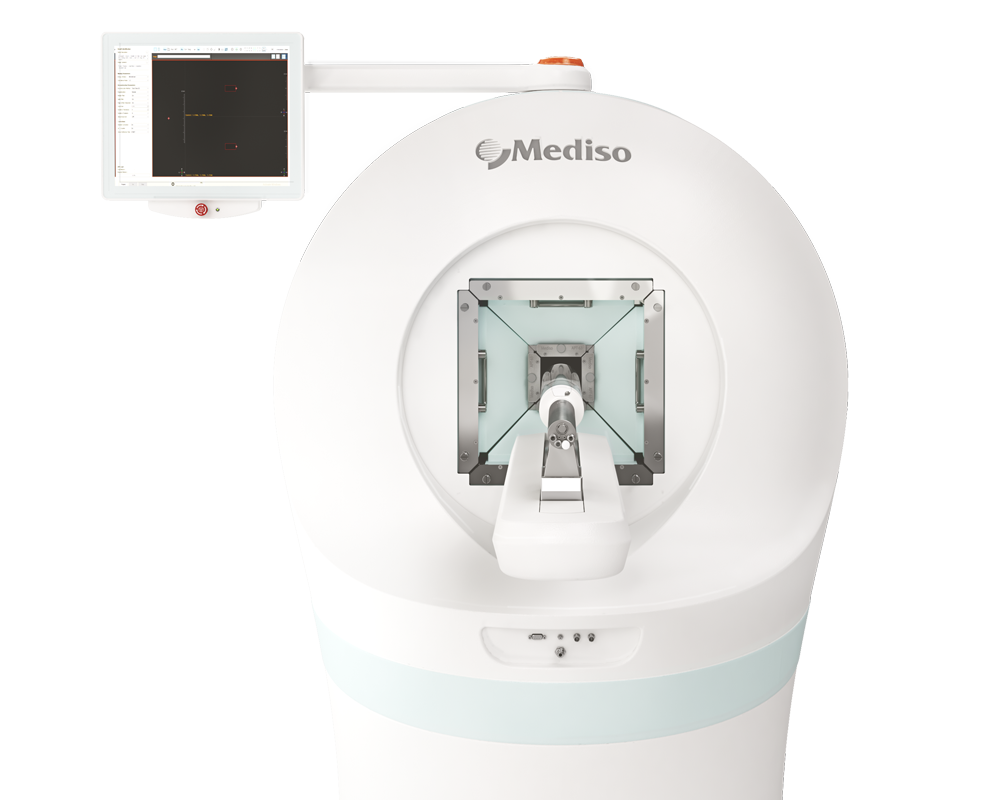
Male athymic nu/nu mice were implanted subcutaneously near the shoulder with 5x10⁶ cells. At 4 weeks after inoculation with A549 (lung tumor) and PC-3 (prostate tumor) cells, the mice were divided into three groups, with 9 or 10 mice in each group. Vehicle or bevacizumab was injected intraperitoneally twice a week from day 0 after baseline imaging. Helical CT and SPECT scans of rats were obtained using a nanoScan SPECT/CT system (Mediso Medical Imaging Systems, Budapest, Hungary). Longitudinal SPECT/CT imaging was performed at baseline (-1), 5, and 15 days after treatment initiation. At 1 h prior to SPECT/CT imaging, 37.0-44.4 MBq 99mTc-3P-RGD2 in 0.1-0.2 ml of saline was administered intravenously via the lateral tail vein.
For radioactivity quantification, the regions of interest were drawn manually to cover the entire tumor, based on a transverse view of the CT image. For tumor delineation with SPECT, a threshold of ≥50% of the maximum pixel value on the SPECT image was chosen.
The tumor uptake of 99mTc-3PRGD2 was expressed as the percent-injected dose (%ID) and %ID/g. Reference regions of interest were drawn over muscle as background radioactivity for tumor-to-muscle (T/M) ratio calculations.
- In the PC-3 Bevacizumab and A549 Vehicle group, the tumor volume increased at 5 and 15 days after therapy. The difference in tumor volume was not significantly different prior to and following treatment in the A549 Bevacizumab group (Figure 1).

Figure 1. Comparison of tumor volumes between the A549 Bevacizumab, A549 Vehicle and PC-3 Bevacizumab groups in the mouse tumor model.
- After 5 and 15 days therapy, the %ID/g value for A549 Bevacizumab group declined. However, for the A549 Vehicle group, the %ID value increased 5 days after injection, but the %ID/g tumor uptake decreased after 5 and 15 days therapy as the weight of the tumor increased (Figure 2).
- For the A549 Bevacizumab and A549 Vehicle groups, the T/M ratio decreased 5 and 15 days after injection. Further SPECT/CT studies confirmed that bevacizumab-treated tumors have persistent tumor uptake decrease. Fig. 3 depicted SPECT/CT images for decreased uptake of 99mTc-3PRGD2 of tumors in the A549 Bevacizumab group after treatment, increased uptake in the A549 Vehicle group, and low uptake of 99mTc-3PRGD2 before and after treatment in the PC-3 Bevacizumab group (Figure 3).

Figure 2. Comparison of the (A) %ID tumor uptake, (B) %ID/g tumor uptake and (C) T/M ratios in A549 Bevacizumab (n=10), A549 Vehicle (n=10) and PC-3 Bevacizumab (n=9) groups. Tumor uptake values and T/M ratios were calculated from SPECT/CT images of the mouse models. ID, injected dose; T/M, tumor-to-muscle
 Figure 3. SPECT/CT images from (A) bevacizumab-treated and (B) vehicle-treated A549 tumor models and (C) bevacizumab-treated PC-3 tumor models. SPECT/CT images were obtained at baseline (-1), and at 5 and 15 days after initiation of bevacizumab therapy.
Full article on spandidos-publications.com
How can we help you?
Don't hesitate to contact us for technical information or to find out more about our products and services.
Get in touch
