Imaging niacin trafficking with positron emission tomography reveals in vivo monocarboxylate transporter distribution
2020.10.01.
Salvatore Bongarzone et al., Nuclear Medicine and Biology, 2020
Summary
A sufficient dietary intake of the vitamin niacin is essential for normal cellular function. Niacin is transported into the cells by the monocarboxylate transporters: sodium-dependent monocarboxylate transporter (SMCT1 and SMCT2) and monocarboxylate transporter (MCT1). Despite the importance of niacin in biological systems, surprisingly, its in vivo biodistribution and trafficking in living organisms has not been reported. The availability of niacin radiolabelled with the short-lived positron emitting radionuclide carbon-11 ([11C]niacin) would enable the quantitative in vivo study of this endogenous micronutrient trafficking using in vivo PET molecular imaging.
Authors described the efficient preparation of [11C]niacin as PET imaging agent for probing the trafficking of nutrient demand in healthy rodents by intravenous and oral administration, providing a translatable technique to enable the future exploration of niacin trafficking in humans and to assess its application as a research tool for metabolic disorders (dyslipidaemia) and cancer.
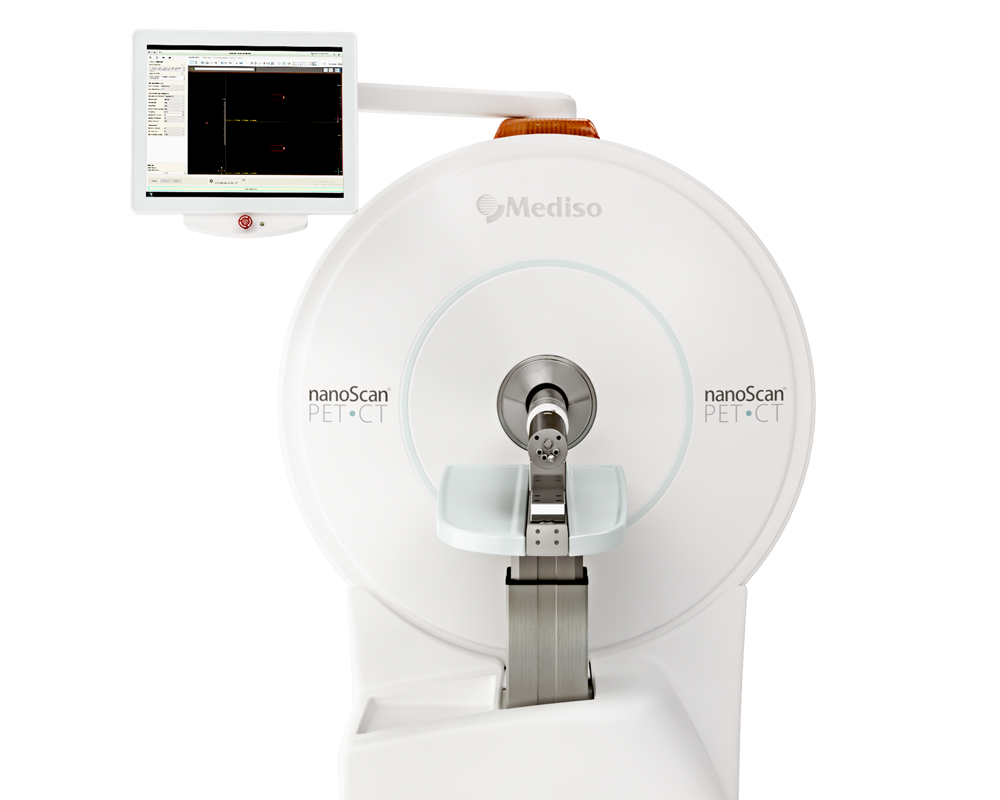
Results from nanoScan PET/CT
- rapid radioactivity accumulation in the kidney, heart, eyes and liver of intravenously administered [11C]niacin which is consistent with the known in vivo SMCTs and MCT1 transporter tissue expression
- pre-administration of non-radioactive niacin decreased kidney-, heart-, ocular- and liver-uptake and increased urinary excretion of [11C]niacin
- pre-administration of AZD3965 selectively decreased [11C]niacin uptake in MCT1-expressing organs such as heart and retina
- following oral administration of NCA [11C]niacin, a high level of radioactivity accumulated in the intestines

PET images of mice receiving [11C]niacin IV. Maximum intensity projections of PET images from: no-niacin-added mice at 0–2.5 min and 1020 min (group A1, A–B, vehicle IV), niacin-challenged mice at 0–2.5 min and 10–20 min (group A3, C-D, niacin IV), AZD3965-challenged mice at 0–2.5 min and 10–20 min (group A4, E–F, AZD3965 IV). Radioactivity of 2.5 ± 0.3 MBq was injected into mice for dynamic PET/CT imaging. PET images are displayed according to the intensity scale for tracer activity, from white (highest), through red (intermediate) to purple (lowest)

PET images of mice receiving [11C]niacin OG. Maximum intensity projections of PET images from mice receiving NCA [11C]niacin (upper row, group B1, vehicle OG) and CA [11C]niacin (lower row, group B2, niacin OG) at 0–3 min (A and D), 5–10 min (B and E) and 60–80 min (C and F) after start of PET imaging. Radioactivity of 3.2 ± 0.7 MBq was administered into mice for dynamic PET/CT imaging. PET images are displayed according to the intensity scale for tracer activity, from white (highest), through red (intermediate) to purple (lowest)
How can we help you?
Don't hesitate to contact us for technical information or to find out more about our products and services.
Get in touch