Summary
Cardiovascular disease is the leading cause of morbidity and mortality worldwide. A large proportion of these fatalities is due to myocardial infarction (MI). Acute inflammation is a key driver of pathology determining disease perturbation after tissue infarction.
The 18-kDa translocator protein (TSPO) is expressed within the outer membrane of the mitochondria, where it is a key factor in controlling the transport of cholesterol necessary for steroid hormone synthesis. TSPO is highly expressed within inflammatory cells such as macrophages in the periphery and microglia in the brain and has consequently been used as a marker of inflammation in pathologies throughout the body.
Although TSPO is one of the most widely explored targets in the field of PET, clinical adoption of this tissue biomarker has been globally hindered by radiotracers with suboptimal properties. For example, the prototypical TSPO ligand 11C-PK11195 has relatively high nonspecific binding and a short half-life. Efforts to surpass the limitations of 11C-PK11195 have been hampered primarily by the differential binding of second-generation TSPO radiotracers now known to be caused by the rs6971 genetic polymorphism. Moreover, the use of TSPO PET radiotracers in the context of cardiovascular disease, in particular after MI, has faced limited adoption due to lack of validated paradigms for quantification of regional tissue inflammation in hypoperfused areas using a single technique or scan. Previously, quantification of regional tissue inflammation after MI has relied on the use of TSPO PET static imaging and SPECT perfusion static scans for correction of the TSPO PET data.
This study aimed to screen novel, fluorinated, TSPO radiotracers for susceptibility to the rs6971 genetic polymorphism using the gold standard in vitro competition binding assays in human brain and heart; assess whether the in vivo characteristics of the authors' lead radiotracer is suitable for clinical translation; and validate whether this novel TSPO radiotracer can detect macrophage-driven inflammation in a rat MI model.
Results from the nanoScan PET/CT
Thirty-two PET scans were performed with 18F-LW223 (17.8 ± 1.5 MBq, intravenous bolus, mean ± SEM). Naïve and MI rat scans were acquired immediately after intravenous bolus injection of 18F-LW223. Blocking studies were performed on rats with PK11195 (1 mg/kg, intravenously) 30 min before they received 18F-LW223. For displacement studies, rats received 18F-LW223 and were scanned continuously for 120 min, with a single dose of PK11195 (1 mg/kg, intravenously) administered at the 60-min time point. Dosimetry studies were conducted using mice and 240-min PET scans.
Data were acquired using the nanoScan PET/CT scanner. A CT scan (semicircular full trajectory, maximum field of view, 480 projections, 50 kVp, 300 ms, and 1:4 binning) was acquired for attenuation correction. Immediately after radiotracer administration, a 120- or 240-min emission scan was obtained using 3-dimensional 1:5 coincidence mode. For rat studies, rebinning was 18 × 10 s, 2 × 30 s, 1 × 60 s, 2 × 2 min, 10 × 5 min, 6 × 10 min, or 18 × 10 min. For mouse studies, rebinning was 4 × 5 min, 4 × 10 min, or 9 × 20 min. Rat PET studies were reconstructed using the iterative TeraTomo 3D reconstruction algorithm, which includes point-spread correction, and the following settings: 4 iterations, 6 subsets, full detector model, low regularization, spike filter on, voxel size of 0.4 mm, and 400- to 600-keV energy window. Mouse dosimetry PET data were reconstructed using filtered backprojection, a voxel size of 0.4 mm, and a 400- to 600-keV energy window. All PET data were corrected for randoms, scatter, and attenuation.
Figure 3. shows 18F-LW223 uptake, assessed in naïve rats, has favorable metabolic profile and specifically targets TSPO in vivo. (A) Maximum-intensity projection of 18F-LW223 PET scan in naïve rat showing major uptake organs (left); metabolism of 18F-LW223 within rat blood showing high percentage of parent radiotracer within plasma up to 2 h after injection (middle, n = 3 per time point); and percentage of parent radiotracer within different tissues demonstrating low level of contaminating radiometabolites (right, n = 3). (B) SUV images of rat heart (left), lung (middle), and brain (right) at baseline (left side of each panel) and under TSPO blockade using prototypical TSPO ligand PK11195 (1 mg/kg, right side of each panel) demonstrating specificity of 18F-LW223 for this target. SUV PET images were filtered using gaussian 1 × 1 × 1 mm filter. (C) Total VT within heart (left), lung (middle), and brain (right) of naïve and TSPO-blocked rats. Results represent mean ± SEM (n = 6 for naïve; n = 3 for blocked). P values were obtained using unpaired t test. A = adrenal glands; B = brain; G = gut; H = heart; K = kidney; L = lung. *P < 0.05. **P ≤ 0.01. ***P ≤ 0.001.
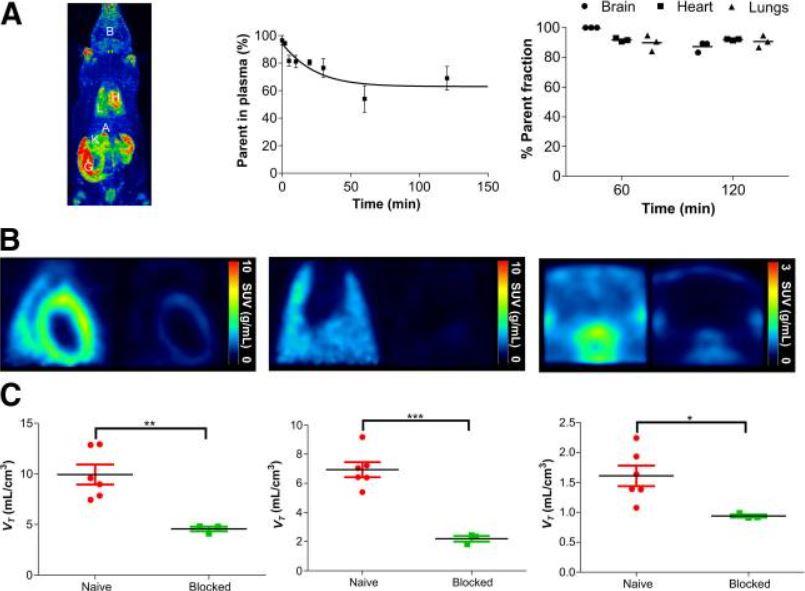
Figure 4. shows 18F-LW223 PET with BPTC quantification detects macrophage-driven inflammation within heart 7 d after MI without need for additional perfusion scan. (A) Long-axis representative SUV image of heart in naïve and MI rats showing increased global uptake and lack of signal within LV anterior wall due to MI-mediated reduction in perfusion (left) (images were filtered using gaussian 1 × 1 × 1 mm filter)); non–perfusion-corrected VT within global heart and LV anterior wall, which was site of infarct (middle); and K1 acting as surrogate marker of perfusion, being reduced within LV anterior wall (right). (B) Representative K1 (left) and BPTC images (middle) of LV of MI rat demonstrating true TSPO signal across heart; BPTC values across global heart and LV anterior wall demonstrating that most TSPO is expressed within infarct (right). n = 6 for natïve and n = 9 for MI.
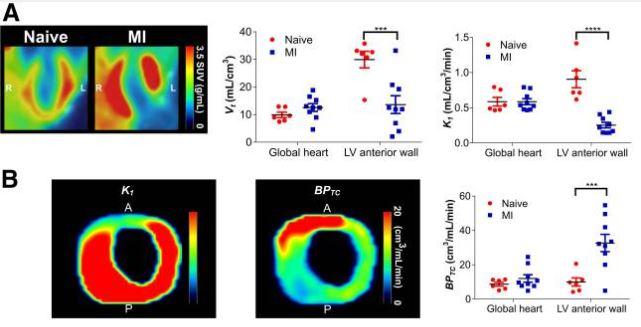
Figure 5. shows the heart–brain axis in health and after MI. (A) Representative 18F-LW223 brain (top, coronal section) and heart (bottom, short axis) PET/CT images of naïve and MI rats (left); CD68 (red) and TSPO (green) immunofluorescence within same animals (middle, scale bar = 1,000 μm); and regional brain immunofluorescence within lateral ventricles of naïve (top) and MI (second from top) rats and within thalamus of naïve (second from bottom) and MI (bottom, scale bar = 20 μm) rats. White arrowheads denote cells that are both CD68- and TSPO-positive; pink arrowheads denote cells positive only for CD68. Cells positive only for TSPO were abundant and are not specifically denoted. (B) Comparison of 18F-LW223 VT in heart and brain of naïve and MI rats showing strong correlation, (n = 15), as is also true for TSPO (n = 8) and CD68 (n = 8). P values were obtained using Pearson correlation. **P ≤ 0.01. **P ≤ 0.0001.
- The authors have developed a novel TSPO radiotracer that is not susceptible to the rs6971 human genetic polymorphism, and also developed an original multiparametric analysis approach.
- Moreover, the authors observed a significant positive correlation between the brain and heart after MI—a correlation that was detected by 18F-LW223 PET imaging in vivo.
Full article on snmjournals.org