Quantitative PET imaging of the CD4 pool in nonhuman primates
2022.08.22.
Insook Kim, Sharat Srinivasula, Paula DeGrange, Brad Long, Hyukjin Jang, Jorge A. Carrasquillo, H. Clifford Lane & Michele Di Mascio
European Journal of Nuclear Medicine and Molecular Imaging, 2022
ABSTRACT
Purpose: Previous SPECT and PET semi-quantitative in vivo imaging studies in monkeys have demonstrated specific uptake of radiolabeled rhesus recombinant anti-CD4 monoclonal antibody fragment CD4R1-F(ab΄)2 in the spleen and clusters of lymph nodes (LNs) but yielded conflicting results of imaging the gut CD4 + T-cell pool. Here, using PET dynamic imaging with kinetic analysis, we performed a fully quantitative CD4 imaging in rhesus macaques.
Methods: The biodistributions of [89Zr]Zr-CD4R1-F(ab΄)2 and/or of [89Zr]Zr-ibalizumab were performed with static PET scans up to 144 h (6 days) post-injection in 18 rhesus macaques with peripheral blood CD4 + T cells/μl ranging from ~ 20 to 2400. Fully quantitative analysis with a 4-h dynamic scan, arterial sampling, metabolite evaluation, and model fitting was performed in three immunocompetent monkeys to estimate the binding potential of CD4 receptors in the LNs, spleen, and gut.
Results: The biodistributions of [89Zr]Zr-CD4R1-F(ab΄)2 and [89Zr]Zr-ibalizumab were similar in lymphoid tissues with a clear delineation of the CD4 pool in the LNs and spleen and a significant difference in lymphoid tissue uptake between immunocompetent and immunocompromised macaques. Consistent with our previous SPECT imaging of [99mTc]Tc-CD4R1-F(ab΄)2, the [89Zr]Zr-CD4R1-F(ab΄)2 and [89Zr]Zr-Ibalizumab uptakes in the gut were low and not different between uninfected and SIV-infected CD4-depleted monkeys. Ex vivo studies of large and small intestines confirmed the in vivo images.
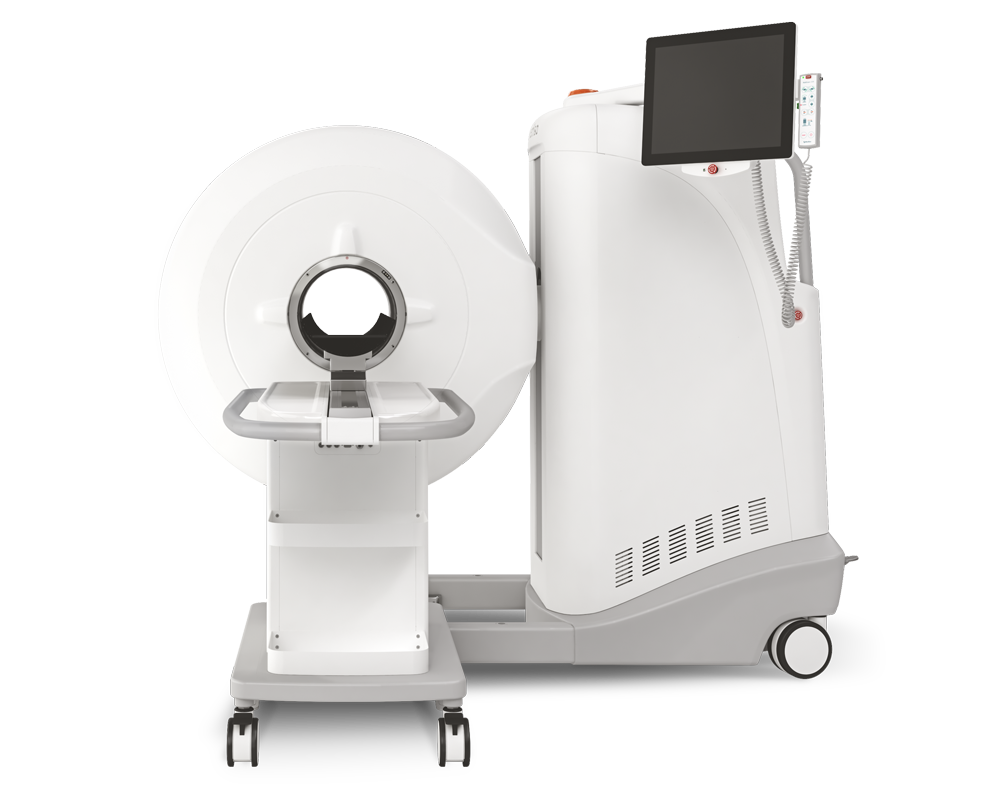
Results from MultiScan™ LFER PET/CT
- This study has provided the first estimate of the CD4 binding potential in the spleen and LNs from in vivo PET dynamic imaging and demonstrated that the gut is not the predominant reservoir of CD4 + T-cells
- [89Zr]Zr-CD4R1-F(ab΄)2 and [89Zr]Zr-ibalizumab were similar in lymphoid tissues with a clear delineation of the CD4 pool in the LNs and spleen
- Tracers' uptake in the gut were low and not different between uninfected and SIV-infected CD4-depleted monkeys

Fig2. Maximum intensity projection in vivo PET images of rhesus macaques and ex vivo PET images of small and large intestines following administration of 1000 μg mass of [89Zr]CD4R1-F(ab′)2. A Maximum intensity projection in vivo PET images of rhesus macaques showing the comparison of radioligand uptake between uninfected controls (DFW6, DGDJ, and DFW2) and SIV-infected animal (37360) scanned at 40 h post-injection. Tissue uptakes were converted to RAINBOW color map as shown in the color bar, where red color indicates the high standardized uptake value (SUV). Comparison of maximum SUV (SUVmax) in tissues and SUV in the plasma (B), and blood pool adjusted SUVmax (rSUVmax) (C) in tissues and plasma between uninfected controls (blue, n = 3) and SIV-infected animal (red, n = 1) at 40 h post-injection. Plasma SUV was calculated from the gamma counter. Plots are mean values and error bars are standard deviation. Maximum intensity projection ex vivo PET images of small and large intestines showing radioligand uptake comparison in the gut sections between one uninfected control (DFW6) and one SIV-infected animal (37360) euthanized at 42–45 h post-injection (D) and their SUV (E, F). The average gut SUVmean was ~ 20-fold lower than the spleen SUVmean in the uninfected control
How can we help you?
Don't hesitate to contact us for technical information or to find out more about our products and services.
Get in touch