Optimisation of Animal Handing and Timing of 2 deoxy 2 [18F] fluoro D glucose PET Tumour Imaging in Mice
2024.11.11.
Richard L. Hesketh et al, Molecular Imaging and Biology, 2024
Summary
Positron emission tomography (PET) with 2-deoxy-2[18F] fluoro-D-glucose ([18F]FDG) is widely used as a surrogate measure of glucose uptake into tissues which can be increased in a range of pathologies including inflammation and malignancy.
However, the uptake of [18F]FDG is affected by numerous factors attributable to variations in biology, scanner and hardware performance, acquisition and reconstruction settings and methods of analysis. Inadequate control of these variables can result in poor repeatability and reproducibility, limiting study comparability and potentially leading to erroneous conclusions.
Clinical guidelines such as those produced by the European Association of Nuclear Medicine (EANM) strived to standardise many of these factors.
In contrast, protocols for pre-clinical small animal imaging lack standardisation, with a multitude of potential biological and technical variables.
In humans, [18F]FDG tumour-to-background contrast continues to increase long after a typical uptake period of 45–60min. Similar studies have not been performed in mice and the static imaging time point for most studies is arbitrarily set at 30–60min post-injection of [18F]FDG. Ideally, static PET imaging should be performed after the initial period of rapid uptake but this period has not been defined in mice, with previous dynamic studies in mice being limited to 60min. This study aimed to define the kinetics of [18F]FDG biodistribution over periods of 3–4h in different murine tumour models, both subcutaneous and autochthonous, and to further refine fasting and warming protocols used prior to imaging.
Dynamic [18F]FDG PET-CT scans lasting 3 or 4h were performed with C57BL/6 J and Balb/c nude mice bearing subcutaneous EL4 murine T-cell lymphoma and Colo205 human colorectal tumours, respectively, and with transgenic Eμ-Myc lymphoma mice. Prior to [18F]FDG injection, four combinations of different animal handling conditions were used: warming for 1h at 31°C; maintenance at room temperature (20–24°C), fasting for 6–10h and a fed state.
Tumour mean standardised uptake value (SUVmean) peaked at 147±48min post injection in subcutaneous tumours and 74±31min in autochthonous Eμ-Myc lymphomas. The tumour-to-blood ratio (TBR) peaked at 171±57 and 83±33min in subcutaneous and autochthonous Eμ-Myc tumours, respectively. Fasting increased tumour [18F]FDG uptake and suppressed myocardial uptake in EL4 tumour-bearing mice. There was a good correlation between tumour SUVmean and Ki calculated using an input function (IDIF) derived from the inferior vena cava.
Conclusion: delayed static [18F]FDG-PET imaging (>60min) in both autochthonous and subcutaneous tumours in improved tumour-to-background contrast and increased reproducibility.
Results from nanoScan® PET/CT
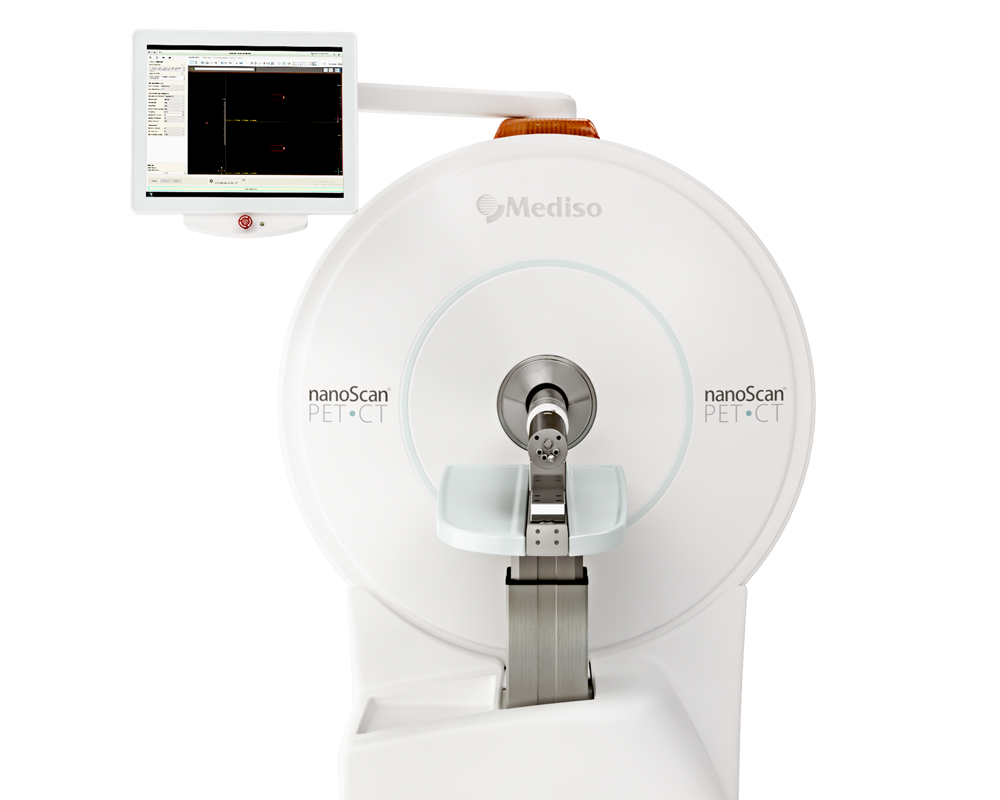
EL4 TIB-39 murine T-cell lymphoma cells and Colo205 metastatic colon adenocarcinoma cells were implanted into the flanks of mice; EL4 cells into adult female C57BL/6 J mice and Colo205 cells into BALB/c nude mice. Tumours were imaged when they were 0.8–1.7 cm3. Dynamic 3h (Colo205 and Eμ-Myc) and 4h (EL4) PET scans were acquired using a nanoScan PET/CT (Mediso, Hungary) and were started immediately prior to intravenous injection over 30s of 12.8±4.2MBq [18F]FDG. Data were reconstructed with an isotropic voxel size of 0.6mm using a 3D ordered-subset expectation maximisation method, two iterations and six subsets. Images were normalised and corrected for decay, dead-time, random events and attenuation. CT images were acquired for anatomic co-registration and attenuation correction. Scans, 3 and 4h, were reconstructed into 91 and 97 time frames, respectively (5s×24; 15s×12; 30s×10; 60s×10; 120s×20; 300s×6, and 600s×9 or 15). For Patlak analysis the data were reconstructed in 2min time frames throughout. The images were analysed using Vivoquant 3.0 software (InviCRO, MA, USA). An image derived arterial input function (AIF) was acquired from a 3D ROI drawn manually over the aorta/inferior vena cava. Tumour, myocardial and Harderian ROIs were defined on the last timepoint using Otsu and 75% max thresholding, respectively. Liver and kidney ROIs were manually drawn on PET images at 1min post-injection. Brain ROIs were drawn on the CT. SUV was calculated as:

where cimg is the activity concentration (MBq/mL) derived from the image ROI, ID is the injected dose (MBq) and BW is the body weight (g) of the animal.
Patlak graphical analysis was used to estimate the net rate of [18F]FDG uptake (Ki) from the linear portion of the graph between 20 and 60min. Patlak multiple-time graphical analysis assumes irreversible uptake of a tracer into a tissue compartment. The rate of accumulation of tracer in a tissue ROI (R) at a time (t) after tracer injection can be expressed as:

where Cp is the plasma activity, V0 is the blood and interstitial volume (the reversible compartment) of the ROI. When plotted graphically, the slope becomes linear after the free [18F]FDG in the reversible compartments has equilibrated with the [18F]FDG in the plasma and has a gradient equal to Ki.
Results show:
- Fasting increased tumour [18F]FDG uptake but warming mice to their thermoneutral temperature prior to [18F]FDG injection did not have a significant effect.
- Delaying static tumour imaging until at least 60min post-injection and after the rapid [18F]FDG uptake period in all animal handling conditions minimises the errors caused by small variations in imaging time.
- At imaging times < 60min, although SUVmean still reflects tumour K i, small variations in post-injection imaging time can cause much larger variations in static measurements of [18F]FDG uptake due to the rapid influx at early timepoints.
- Late delayed imaging (>90min post injection) may be of benefit where maximal tumour-to-background contrast is required, particularly in subcutaneous tumours or when imaging tumours in organs that demonstrate minimal or reversible uptake.

Example dynamic [18F]FDG-PET images of a warmed and fasted EL4 tumour-bearing mouse. (i, iv) Whole body 3D reconstructions and (ii, iii, v, vi) axial slices of [18F]FDG-PET/CT images through the heart and tumour. Arrows: 10s, pink arrow – inferior vena cava / aorta; 55s, green arrow – right kidney; 240s, blue arrow – Harderian gland; white arrow – myocardium; orange arrow – bladder; yellow arrow – tumour
Full article on springer.com
How can we help you?
Don't hesitate to contact us for technical information or to find out more about our products and services.
Get in touch
