In vivo real-time positron emission particle tracking (PEPT) and single particle PET
2024.01.19.
Juan Pellico et al, Nature Nanotechnology, 2024
Summary
Positron emission particle tracking (PEPT) enables 3D localization and tracking of single positron-emitting radiolabelled particles with high spatiotemporal resolution. The translation of PEPT to the biomedical imaging field has been limited due to the lack of methods to radiolabel biocompatible particles with sufficient specific activity and protocols to isolate a single particle in the sub- micrometre size range, below the threshold for capillary embolization. Here we report two key developments: the synthesis and 68Ga-radiolabelling of homogeneous sub-micrometre-size silica particles (smSiP) of 950 nm diameter with unprecedented specific activities (2.1 ± 1.4 kBq per particle), and the isolation and manipulation of a single particle. We have combined these developments to perform in vivo PEPT and dynamic positron emission tomography (PET) imaging of a single radiolabelled sub-micrometre size particle using a pre-clinical PET/CT scanner. This work opens possibilities for quantitative assessment of haemodynamics in vivo in real time, at the whole-body level using minimal amounts of injected radioactive dose and material.
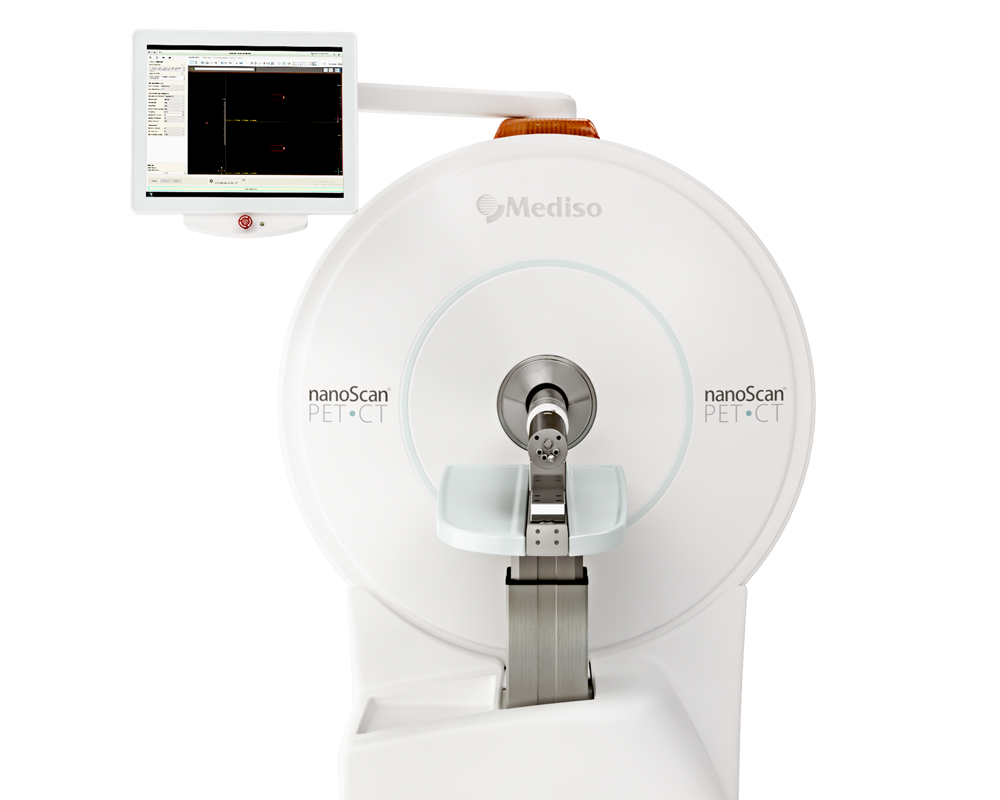
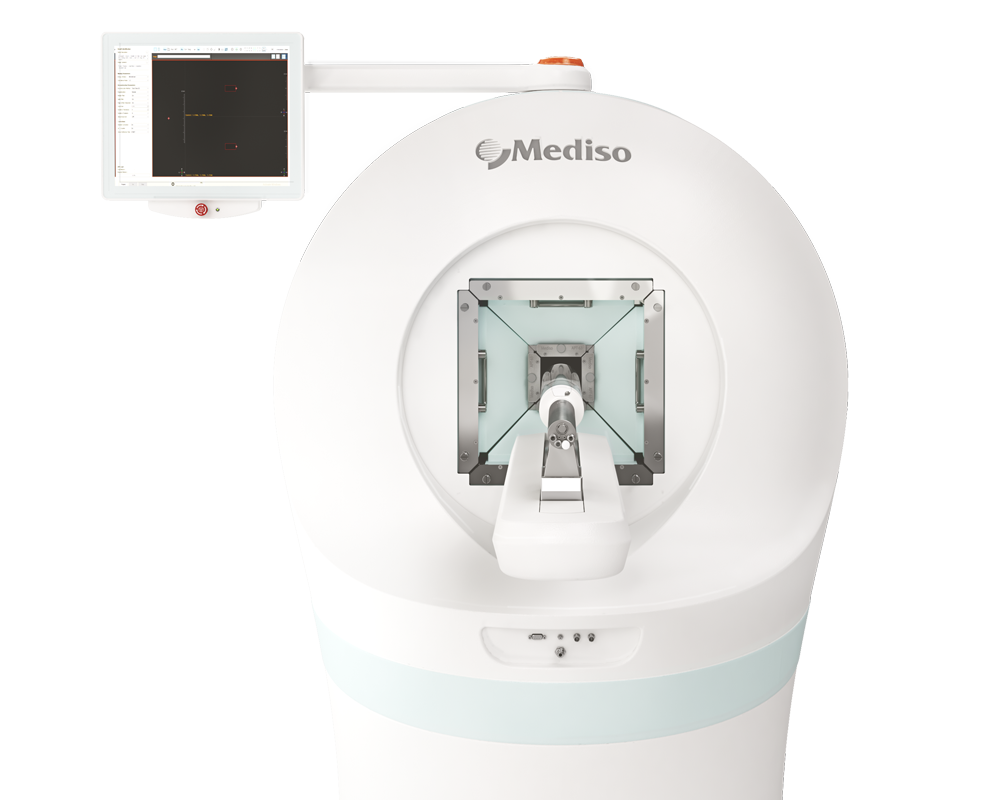
Results from nanoScan® PET/CT
- Silica particles were synthesized using the Stöber method then radiolabeled with 68 To test whether the sensitivity of the pre-clinical PET scanner was sufficient to provide high-quality images with this level of radioactivity, a sample tube with a single 2.1 kBq 68Ga-smSiP was imaged for 2 h. The images demonstrated sufficient sensitivity at different 5-min time frames (Fig. 3a)

Fig. 3a: In vitro PET/CT imaging 0–5, 5–10, 25–30 and 55–60 min of acquisition of a single 2.1 kBq 68Ga-smSiP suspended in 50 µl of PBS 1× in a sample tube showing enough sensitivity of the scanner to detectthat level of radioactivity.
- In vivo PET/CT imaging was then carried out in healthy BALB/c mice. Dynamic PET reconstructions of a mouse injected with a 1.5 kBq 68Ga-smSiP through the tail vein clearly revealed a single hotspot in the lung at only 5 min post-injection. Interestingly, this particle experienced a subtle movement to an inferior right part of the lungs between 5 min and 10 min post-injection, remaining static afterwards (Fig. 3c).

Fig. 3c: In vivo PET/CT imaging of a BALB/c mouse at 0–5, 5–10, 25–30 and 55–60 min after intravenous injection of a single 1.5 kBq 68Ga-smSiP. Regions of interests (ROIs) were drawn and represented in 55–60 min to delimit the lungs (yellow), the heart (blue) and the liver (red) for better clarity. Scale bar represents the standardised uptake value (SUV).
For each time frame of the PET reconstructions, a region of interest was outlined around the particle to quantify the signal. The decay corrected mean value of activity was 97 ± 3% of the injected activity. While the activity quantification in PET may not seem relevant for the end application of in vivo PEPT, it does show that the signal could be well characterized at low activities.
Using the list-mode datasets originated through the PET acquisitions, the particle position was tracked using the Birmingham method for PEPT.
Figure 4a shows the PET images with the particle in the lungs in the first 5 min and moving position towards an inferior right part of the lung between 5–10 min post administration. Figure 4b–d shows
the tracking of the particle at different timepoints, with the particle position registered to the CT.

Fig. 4a: Superimposed in vivo PET/CT images of a BALB/c mouse at 0–5 min and 5–10 min after intravenous injection of a single 1.5 kBq 68Ga-smSiP with regions of interest (ROIs) drawn and represented to delimit the lungs (yellow) and the heart (blue). b–d: PEPT technique applied to a mouse using the listmode data generated from the PET acquisition.
Immediately following injection in the tail vein, the particle motion was rapid (speed approximately approximately 48 mm s-1). Within the first 30 s of the scan, the first tracking point for the particle can be seen first in the lower abdomen; subsequently, the tracking reveals it travels through the heart and moves to the inferior region of the lungs. The anterior–posterior movement of the particle once within the lungs was confined to approximately ±2 mm, suggesting that the motion followed the breathing pattern of the mouse.
Full article on nature.com
W czym możemy pomóc?
Skontaktuj się z nami aby uzyskać informacje techniczne i / lub wsparcie dotyczące naszych produktów i usług.
Napisz do nas