In vivo localization of chronically implanted electrodes and optic fibers in mice
2020.09.20.
Bálint Király et al., Nature Communications, 2020
Summary
One of the most common approaches of modern experimental neuroscience is recording or influencing the activity of small brain areas or specific cortical layers in live laboratory animals. For instance, electrophysiology provides a direct readout of neuronal firing at the single-cell level with high temporal resolution. In addition, the recent advent of optogenetics allows activating or suppressing genetically defined groups of neurons via the cell-type-specific expression of light-gated ion channels and light delivery via optic fibers. The combination of the two enables optogenetic tagging, i.e., light-guided assessment of neuron identity during extracellular recordings from awake- behaving animals. Finally, fiber photometry techniques are on the rise, requiring fiber-optic implants similar to optogenetic experiments.
Mice represent an attractive model due to their relatively low price, short generation time, genetic tractability, complex behaviors, and a level of reported homology between rodent and primate brains. However, surgeries on the mouse brain have gradually become more demanding and error-prone as the field moves toward more complex experiments, aiming at small and often multiple targets simultaneously, hitting the same target multiple times (e.g., virus injection and optic-fiber implantation), or implanting at unusual angles to avoid large blood vessel. Errors are only discovered at the end of the experiments by postmortem histological reconstruction, often resulting in months of wasted experimental work and lab resources, especially when behavioral training is involved.
In order to improve the efficiency of these experiments, the authors have developed a new procedure in mice inspired by techniques used in human deep-brain surgery and brain radiation therapy. They have used high-resolution micro-CT imaging that allowed accurate measurements of tetrode electrodes, silicon probes, and optical fibers with respect to bone landmarks. Improving the resolution and the signal-to-noise ratio (SNR) of CT images may be achieved at the expense of increased radiation dose. However, CT does not provide soft-tissue contrast, making it difficult to judge whether the implant is in the target area. Therefore, the authors have performed structural MRI scans that provide excellent soft-tissue contrast and merged them with the micro-CT images, similar to human surgery techniques. This noninvasive in vivo localization technique enables verifying the success of implantation directly after surgery, and increases the efficiency of the experiment by (i) adjusting the recording depth to reach the target, (ii) terminating in the case of mistargeting or other problems, and (iii) systematically improving surgery skills by providing fast feedback.
Results from the nanoScan MRI 3T and NanoX-CT
For the preoperative scans, CT measurements were performed on a NanoX-CT (Mediso Medical Imaging Systems, Budapest, Hungary) cone-beam micro-CT imaging system with an 8-W power X-ray source. Following the ALARA principle, to minimize radiation dose, the authors used simple circular scanning to scan the head of the animal only. Preoperative CT imaging parameters were set to minimize the radiation dose: tube voltage, 45 kVp; magnification, 1.36; exposure time, 500 ms; number of projections, 180. These represent minimal values within the adjustable range with 3-min acquisition time.
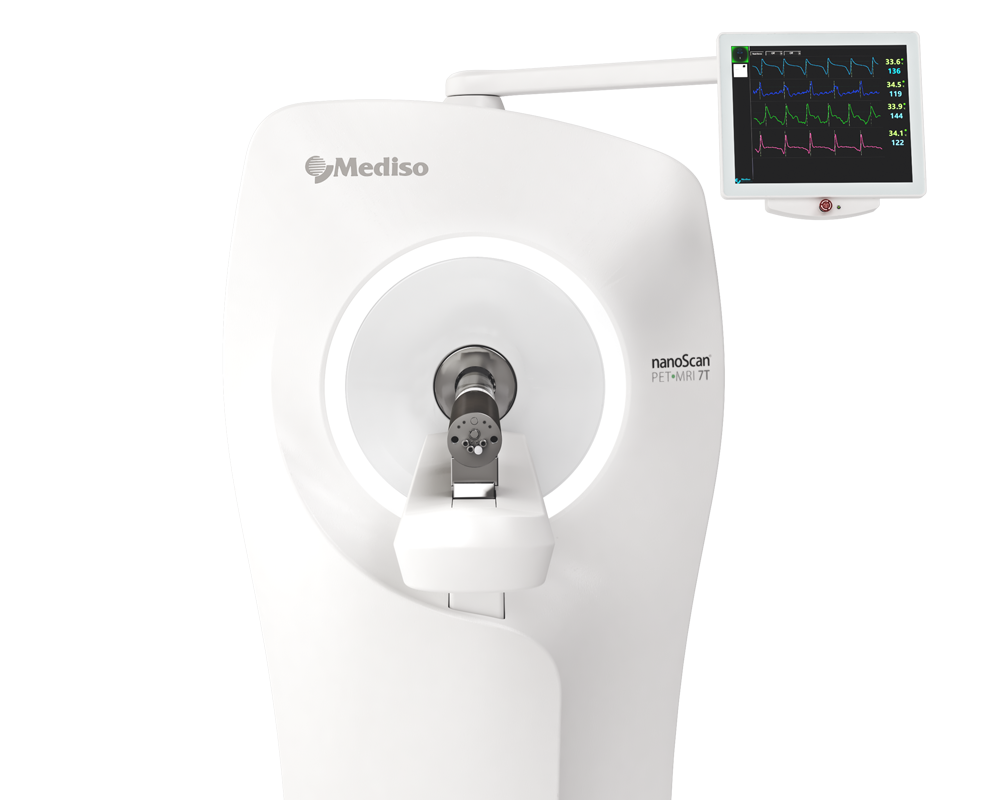
Magnetic resonance imaging was performed with a nanoScan PET/MRI system (Mediso Medical Imaging Systems, Budapest, Hungary), which is equipped with a permanent magnetic field of 1 T and with a 450 mT m−1 gradient system using a volume coil for both reception and transmission. Fast T1-weighted images were acquired with a 3D gradient echo sequence using 8 excitations, TR = 15-ms repetition, and TE = 2.2-ms echo times and 25° flip angle with resolution set to 0.28 mm.
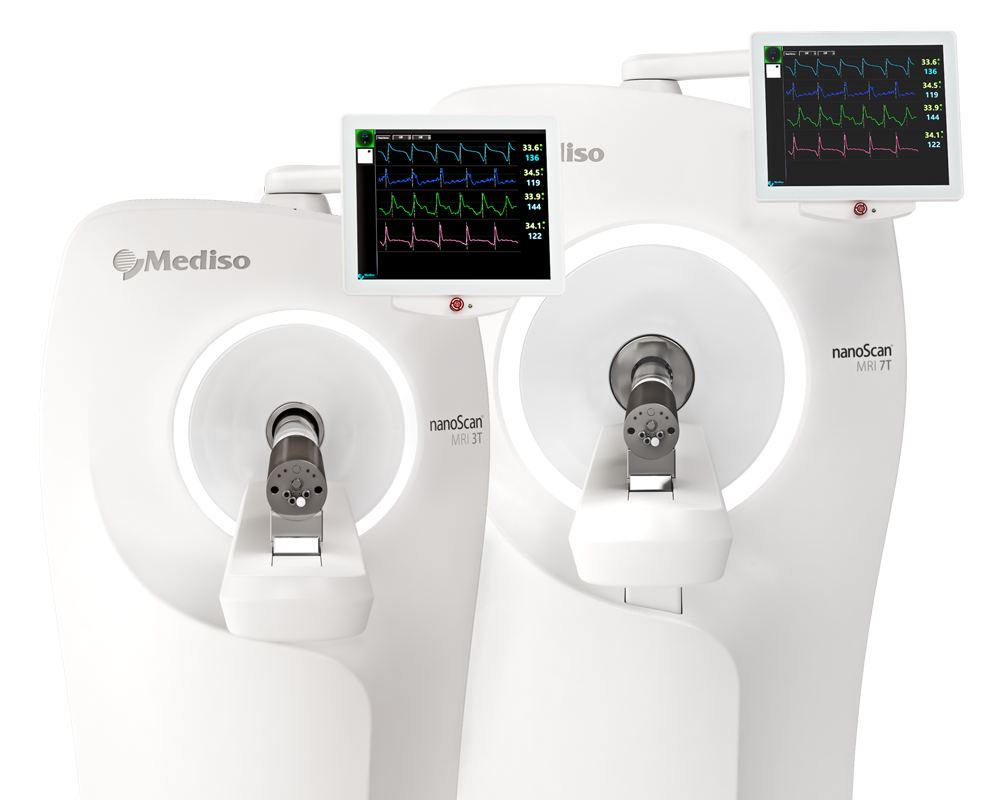
Translational-field magnetic resonance imaging was performed with a nanoScan 3T MRI system (Mediso Medical Imaging Systems, Budapest Hungary) with a 3T cryogen-free superconducting magnet and with a 600 mT m−1 gradient system using a 72-mm volume coil for transmission and a 20-mm surface coil for signal reception. High SNR T1-weighted images were acquired with a 3D gradient echo sequence using three excitations, TR = 25-ms repetition and TE = 2.7-ms echo times and 30° flip angle with resolution set to 0.2 mm, which enabled to visualize the hippocampal formation with 20-min acquisition time.
For the postoperative scans, CT acquisition was set up with 500–1300-ms exposure time, 180–360 projections, and 1.36–2.47 magnification, with the tube voltage set to 45 kVp. Regarding the MRI, postoperative MRI imaging was done with the 3T system, 1 week after the surgery. High-resolution T2/T1-weighted 3D-balanced steady-state free-precession (bSSFP) sequence was performed using 12 excitations, TR = 5.13-ms repetition, and TE = 2.565-ms echo times and 40° flip angle with resolution set to 0.12 × 0.12 × 0.15 mm. High-resolution T2-weighted 2D fast spin echo sequence was performed using 20 excitations, TR = 3000-ms repetition, and TE = 98.9-ms echo times with resolution set to 0.1 × 0.1 × 0.6 mm.
Figure 5. is showing the localization of hippocampal implants with 3T MRI imaging: a The postoperative CT image co-registered with the high signal-to-noise ratio (SNR) T1-weighted preoperative MRI image shows the hippocampus (white dashed box) in addition to the ventricles (blue arrows). The yellow arrow shows the position of an edge silicon probe in the hippocampus. Images from left to right, maximum intensity projection, sagittal slice, horizontal slice, and coronal slice. Yellow numbers refer to the corresponding stereotaxic coordinates in mm relative to Bregma. b Three-dimensional atlas co-registered with the postoperative CT image using the CT–MRI fusion technique with special attention to the alignment of the hippocampal structure. c Left, localized trajectory of the probe in the hippocampus. Right, layer-specific reconstruction of 32 contact sites (Or oriens layer, Py pyramidal layer, Rad stratum radiatum, LMol lacunosum moleculare, Mol molecular layer, GrDG granular layer, PoDG polymorph layer, DG dentate gyrus). CT and MRI images are shown in grayscale and goldscale, respectively.

Figure 6. is showing the localization of nonmetal implants with postoperative MRI imaging: a The postoperative T2/T1-weighted MRI image shows the tracks of bilaterally implanted optic fibers (magenta arrow, 50-µm core diameter, right hemisphere; white arrow, 105-µm core diameter, left hemisphere). Anatomical landmarks are discernable, including ventricles (blue arrows), the corpus callosum (yellow arrows), and the hippocampal fissure (red arrow). Images from left to right, maximum intensity projection, sagittal slice, horizontal slice, and coronal slice. Yellow numbers refer to the corresponding stereotaxic coordinates in mm relative to Bregma. b Slice-by-slice comparison of the in vivo postoperative MRI images (right) and histology (left, dark-field images overlaid with fluorescent micrographs of nuclear DAPI staining). The corresponding coronal plane of the Paxinos atlas was fitted on the slices marked by white dashed boxes. Scale bar, 1 mm. c High signal-to-noise ratio (SNR) postoperative T2-weighted MRI images were acquired from thick (600-µm) coronal slices from both animals. Numbers indicate the depth of the implant tips relative to the hippocampal fissure in mm. MRI images are shown in goldscale.

- The authors have developed a noninvasive in vivo localization technique for radiodense implants in mice by combining different structural imaging modalities. They were able to localize deep-brain implants targeting small nuclei as well as superficial implants targeting layered structures, with a precision comparable to postmortem histological reconstruction.
- They have further shown that nonmetal implants can be localized by postoperative MRI scans, otherwise prevented by metal objects in the case of electrodes.
- The authors have shown that in vivo localization based on the CT–MRI fusion technique, and postoperative MRI of metal-free implants, provides the same level of accuracy as histological track reconstruction with comparable time investment (~2–3 h per animal with CT–MRI fusion, and 1 h per animal with postoperative MRI scans).Moreover, the structural information provided by the MRI imaging improved the accuracy of the in vivo localization along the anteroposterior axis.
Full article on nature.com
W czym możemy pomóc?
Skontaktuj się z nami aby uzyskać informacje techniczne i / lub wsparcie dotyczące naszych produktów i usług.
Napisz do nas
