Longitudinal [18]UCB-H/[18F]FDG imaging depicts complex patterns of structural and functional neuroplasticity following bilateral vestibular loss in the rat
2022.04.11.
Melissa Antons et al, Scientific Reports, 2022
Summary
Neuronal lesions trigger mechanisms of structural and functional neuroplasticity, which can support recovery. However, the temporal and spatial appearance of structure–function changes and their interrelation remain unclear.
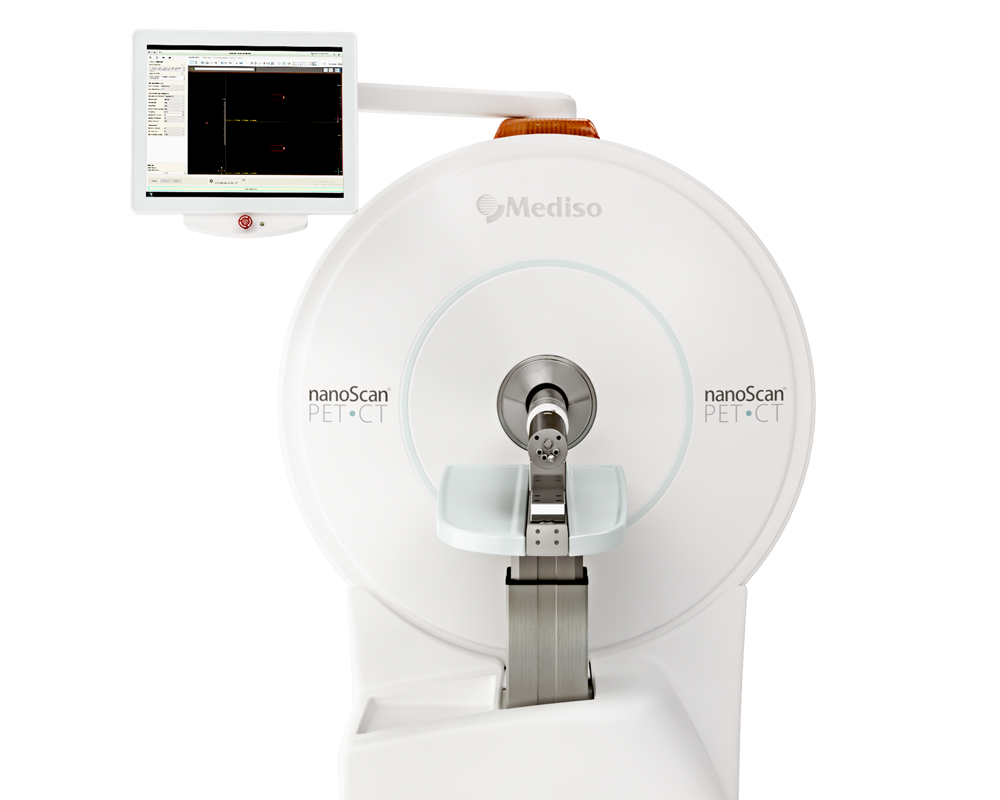
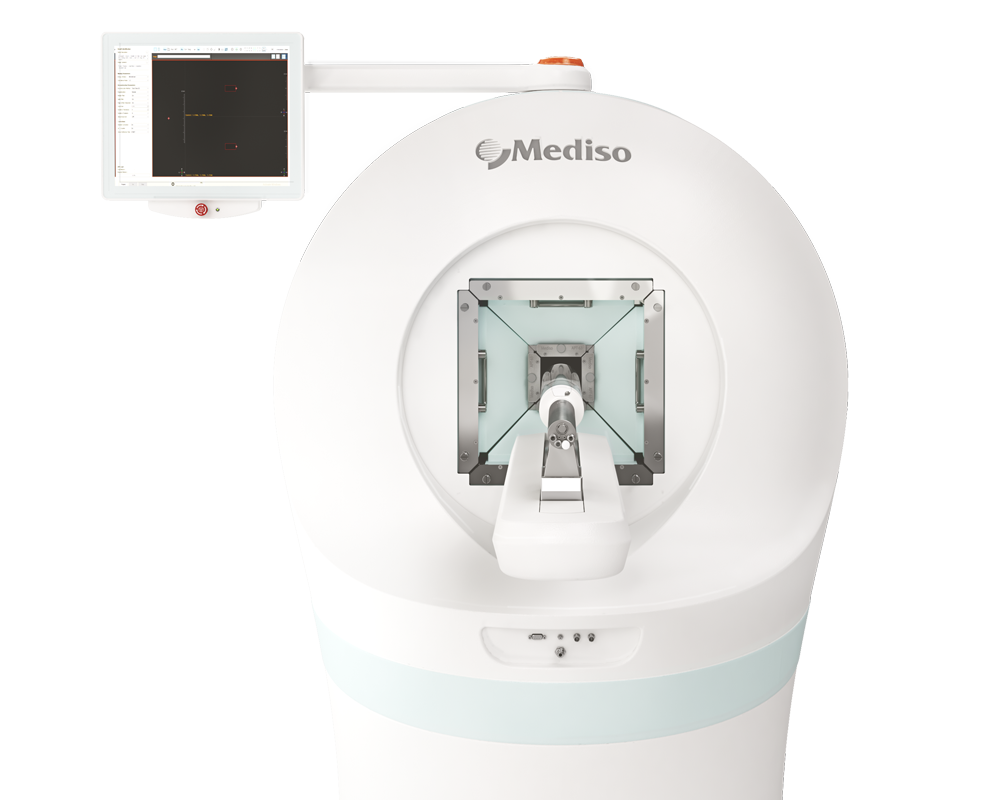
The current study aimed to directly compare serial whole-brain in vivo measurements of functional plasticity (by 18FDG-PET) and structural synaptic plasticity (by 18F-UCB-H-PET) using nanoScan PET/CT before and after bilateral labyrinthectomy in rats and investigate the effect of locomotor training.
Complex structure–function changes were found after bilateral labyrinthectomy: in brainstem-cerebellar circuits, regional cerebral glucose metabolism (rCGM) decreased early, followed by reduced synaptic density.
In the thalamus, increased 18F-UCB-H binding preceded a higher rCGM uptake. In frontal-basal ganglia loops, an increase in synaptic density was paralleled by a decrease in rCGM. In the group with locomotor training, thalamic rCGM and 18F-UCB-H binding increased following bilateral labyrinthectomy compared to the no training group. Rats with training had considerably fewer body rotations. In conclusion, combined 18FDG/18F-UCB-H dual tracer imaging reveals that adaptive neuroplasticity after bilateral vestibular loss is not a uniform process but is composed of complex spatial and temporal patterns of structure–function coupling in networks for vestibular, multisensory, and motor control, which can be modulated by early physical training.
Results from nanoScan PET/CT
Male Sprague–Dawley rats underwent a chemical BL by injection of bupivacaine and p-arsanilic acid. Sequential whole brain PET imaging with 18F-UCB-H81 and 18FDG combined with CT imaging was performed at baseline and 1, 3, 5, 7 and 9 weeks post BL. In the respective weeks, 18F-UCB-H imaging was done first, followed by 18FDG imaging with an interscan interval of >24 h. All animals underwent behavioural testing by instrumental analysis of locomotion and spatial orientation in the open field at baseline and 1, 2, 3, 5 days, as well as 1, 2, 3, 4, 5, 6, 7, 8, 9 weeks after BL.
For PET/CT imaging, animals were anesthetized the lateral tail vein was catheterized and a bolus of the tracer was injected (40MBq per tracer). The animals were positioned in the PET/CT scanner and were kept warm with a heating pad. To avoid any passive movement of the head, its position was fixed using a custom-made head-holder. For individual attenuation correction, CT scan was performed for each measurement. While the 18F-UCB-H PET measurements started right after injection, data processing was based on a 30min time frame starting at 30 min post injection. 18FFDG scans were acquired from 30 to 60min post injection and data were analysed for this 30min time frame. In this setting, animals were allowed to wake up for 15min after tracer injection before PET/CT scan was initiated. The PET reconstruction procedure was an Ordered Subsets Expectation Maximization (OSEM-3D) algorithm with decay/attenuation/scatter/dead time correction and sensitivity normalization.
Activity distributions were used as a surrogate for cerebral synaptic density in the case of 18F-UCB-H and as a surrogate for cerebral glucose consumption in the case of 18FDG scans. The volume containing the brains in the images was cropped and rigidly registered into PX Rat atlas space (W. Schiffer) in PMOD. To achieve comparability, normalization to the whole brain mean activity was performed after applying a 0.4mm isotropic Gaussian filter, using a brain mask in atlas space in a self-written Python script. Subsequently, the images were segmented into brain regions using Px Rat (W. Schiffer) atlas and mean whole brain normalized activity values for every brain region were extracted. In addition, regions of interest (ROI) for the left and right vestibular nucleus were defined. Mean normalized activity values were extracted for the left and right vestibular nucleus ROI and included in the further analysis.
Results show:
- synaptic density decreased significantly in 16.7% and increased in 15% of all brain regions post BL
- rCGM decreased in 33.3% of all regions
- serial 18F-UCB-H measurements indicated a main cluster with an overall decrease of synaptic density in brainstem-cerebellar networks (e.g., vestibular nuclei, cerebellar white matter, colliculus inferior, midbrain)

Figure 1. Overview of the changes in synaptic density measured by 18F-UCB-H PET (left side) and regional cerebral glucose metabolism (rCGM) measured by 18FDG PET (right side) in 28 selected brain regions, which are known to be involved in vestibular and sensorimotor processing. Mean normalized activity values per segmented brain region at 1, 3, 5, 7 and 9 weeks post bilateral labyrinthectomy (BL) were statistically compared using a one-way repeated measurement ANOVA with post-hoc paired t-tests and Bonferroni correction for multiple testing. Significant increases in synaptic density or rCGM are visualized in red scales (light red: p < 0.05, red: p < 0.005, dark red: p < 0.001), decreases in blue scales (light blue: p < 0.05, blue: p < 0.005, dark blue: p < 0.001).
- Brain regions with a synaptic increase clustered in the orbitofrontal, prefrontal, and frontal association cortex (mean onset 1–5 weeks post BL), as well as in the striatum (7 and 9 weeks post BL).
- Sensory cortical areas showed a diverse pattern with a decreased binding in the auditory and somatosensory cortex after week 3 post BL, whereas visual cortex showed no change at any time point.
- Spatial patterns of 18FDG uptake showed clusters of early-onset rCGM decrease in the brainstem (vestibular nuclei, colliculus inferior), orbitofrontal, olfactory, auditory and insular cortex from 1 week post BL, and later rCGM decrease in other sensory cortical regions (including the visual, somatosensory cortex from 3 weeks post BL), as well as in the motor cortex and striatum (from 3 weeks post BL).
- A marked decrease of rCGM (compared to baseline) started in the vestibular nuclei and adjacent vestibular cerebellum in week 1 and persisted up to week 9 post BL.
- loss of synaptic density was observed with a temporal delay, beginning at 3 weeks and progressing until 9 weeks post BL
- Similar dynamics were found in the colliculus inferior, which display a reduced 18FDG uptake from week 1–9 post BL, while 18F-UCB-H binding decreased progressively from week 3 post BL. Parietal multisensory cortex areas showed an early rCGM decrease (week 1) and a delayed loss in synaptic density (week 3).

Figure 2. Comparison of regional cerebral glucose metabolism and synaptic density in the brainstem, cerebellum and multisensory cortex. Early decrease in 18FDG uptake is followed by reduced 18F-UCB-H binding in the vestibular nuclei, adjacent vestibular cerebellum (a), colliculus inferior and multisensory cortex (b). C: caudal, R: rostral, Le: left, Ri: right, CI: colliculus inferior, MC: multisensory cortex, VC: vestibular cerebellum, VN: vestibular nucleus.
- Synaptic density in the posterolateral thalamus increased progressively from week 1 to 9 post 18FDG uptake started to increase with a temporal delay at week 5 post BL at the same anatomical location and further advanced until week 9 post BL

Figure 3. Comparison of regional cerebral glucose metabolism and synaptic density in the thalamus. Early increase of synaptic density in the posterolateral thalamus was succeeded by more 18FDG uptake during weeks 5 to 9 post BL. A: anterior, P: posterior, Le: left, Ri: right, TH: thalamus.
- In the frontal cortex-basal ganglia loops, voxel-based analysis showed an inverted pattern of 18FDG uptake and 18F-UCB-H binding. While rCGM in the frontal association cortex was reduced from week 1 post BL, synaptic density increased after week 3 post BL. In parallel, striatal rCGM decreased after week 3 post BL, while synaptic density bilaterally increased in this brain region

Figure 4. Comparison of regional cerebral glucose metabolism and synaptic density in frontal–basal ganglia networks. Reduced 18FDG uptake in the frontal association cortex and striatum was paralleled by an increase in 18F-UCB-H binding. A: anterior, P: posterior, Le: left, Ri: right, BG: basal ganglia, FA: frontal association cortex.
- In the thalamus, voxel-based analysis showed a significantly higher uptake of 18FDG and 18F-UCB-H in the training group. Synaptic density increased in week 1 and rCGM in week 1 and week 3 post BL

Figure 5. Comparison of regional cerebral glucose metabolism and synaptic density in the thalamus in the training and no training groups. Increased 18FDG uptake in the thalamus was paralleled by an increase in 18F-UCB-H binding in the training group. A: anterior, P: posterior, Le: left, Ri: right, TH: thalamus.
Full article on nature.com
Hogyan segíthetünk Önnek?
További termékinformációkért, vagy támogatásért keresse szakértőinket!
Vegye fel a kapcsolatot
