In vivo characterization of glutamine metabolism identifies therapeutic targets in clear cell renal cell carcinoma
2022.12.08.
Akash K Kaushik et al., 2022 Science Advances
Abstract
Targeting metabolic vulnerabilities has been proposed as a therapeutic strategy in renal cell carcinoma (RCC). Here, we analyzed the metabolism of patient-derived xenografts (tumorgrafts) from diverse subtypes of RCC. Tumorgrafts from VHL-mutant clear cell RCC (ccRCC) retained metabolic features of human ccRCC and engaged in oxidative and reductive glutamine metabolism. Genetic silencing of isocitrate dehydrogenase-1 or isocitrate dehydrogenase-2 impaired reductive labeling of tricarboxylic acid (TCA) cycle intermediates in vivo and suppressed growth of tumors generated from tumorgraft-derived cells. Glutaminase inhibition reduced the contribution of glutamine to the TCA cycle and resulted in modest suppression of tumorgraft growth. Infusions with [amide-15N]glutamine revealed persistent amidotransferase activity during glutaminase inhibition, and blocking these activities with the amidotransferase inhibitor JHU-083 also reduced tumor growth in both immunocompromised and immunocompetent mice. We conclude that ccRCC tumorgrafts catabolize glutamine via multiple pathways, perhaps explaining why it has been challenging to achieve therapeutic responses in patients by inhibiting glutaminase.
Results from the nanoScan PET/CT
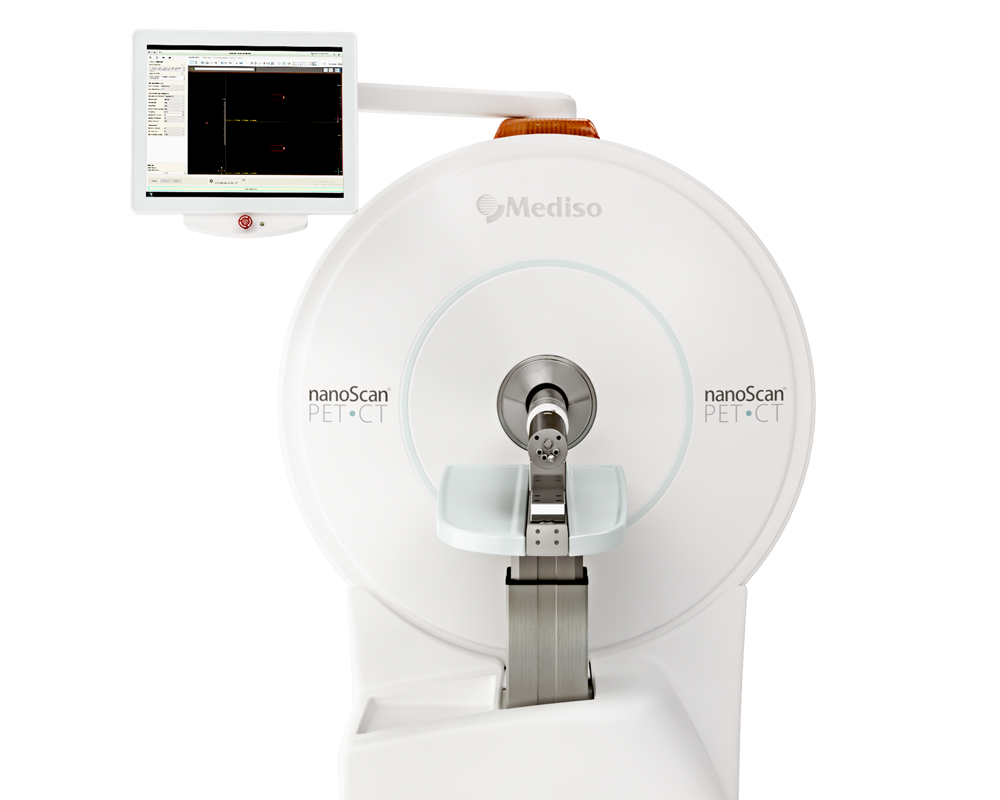
A 9 cm-long catheter of 0.38-mm inner diameter fitted with a 27-gauge needle was inserted into the tail of a tumor-bearing mouse for intravenous injection of l-[5-11C]-glutamine (~ 5 MBq per mouse). Dynamic PET data acquisition was performed on a Mediso NanoScan PET/CT System (Mediso, USA) immediately after the injection for up to 40 min, followed by a CT scan with 720 projections.
- glutamine is a carbon source for intermediary metabolism in ccRCC tumorgrafts relative to nonmalignant kidney
- The PET data indicate retention of glutamine carbon (specifically, carbon 5) within the tumors
- A significantly increased ratio of signal uptake relative to the peak time point demonstrated higher signal retention in the tumors (both orthotopic and subcutaneous) relative to kidney

Figure S6. MRI and L-[5-11C]glutamine PET/CT analysis in ccRCC tumorgrafts. (A). MRI and PET/CT of mice bearing both orthotopic and subcutaneous XP490 tumorgrafts (n=3 mice). MRI was used to localize the relevant tissues in these imaging planes. PET/CT images show the signal from L-[5-11C]glutamine for kidney and tumors. (B). Kinetics of L-[5- 11C]glutamine displayed as % injected dose per gram of mouse (%ID/g) in the kidney (red), orthotopic tumor (blue), and subcutaneous tumor (purple). Data plotted from n=3 mice.
Hogyan segíthetünk Önnek?
További termékinformációkért, vagy támogatásért keresse szakértőinket!
Vegye fel a kapcsolatot