GLP-1R/GCGR dual agonism dissipates hepatic steatosis to restore insulin sensitivity and rescue pancreatic β-cell function in obese male mice
2025.08.21.
Rhianna C Laker et al., Nature Communication, 2025
Abstract
An early driver of Type 2 diabetes mellitus (T2D) is ectopic fat accumulation, especially in the liver, that impairs insulin sensitivity. In T2D, GLP-1R/GCGR dual-agonists reduce glycaemia, body weight and hepatic steatosis. Here, we utilize cotadutide, a well characterized GLP-1R/GCGR dual-agonist, and demonstrate improvement of insulin sensitivity during hyperinsulinemic euglycemic clamp following sub-chronic dosing in male, diet-induced obese (DIO) mice. Phosphoproteomic analyses of insulin stimulated liver from cotadutide-treated mice identifies previously unknown and known phosphorylation sites on key insulin signaling proteins associated with improved insulin sensitivity. Cotadutide or GCGR mono-agonist treatment also increases brown adipose tissue (BAT) insulin-stimulated glucose uptake, while GLP-1R mono-agonist shows a weak effect. BAT from cotadutide-treated mice have induction of UCP-1 protein, increased mitochondrial area and a transcriptomic profile of increased fat oxidation and mitochondrial activity. Finally, the cotadutide-induced improvement in insulin sensitivity is associated with reduction of insulin secretion from isolated pancreatic islets indicating reduced insulin secretory demand. Here we show, GLP-1R/GCGR dual agonism provides multimodal efficacy to decrease hepatic steatosis and consequently improve insulin sensitivity, in concert with recovery of endogenous β-cell function and reduced insulin demand. This substantiates GLP-1R/GCGR dual-agonism as a potentially effective T2D treatment.
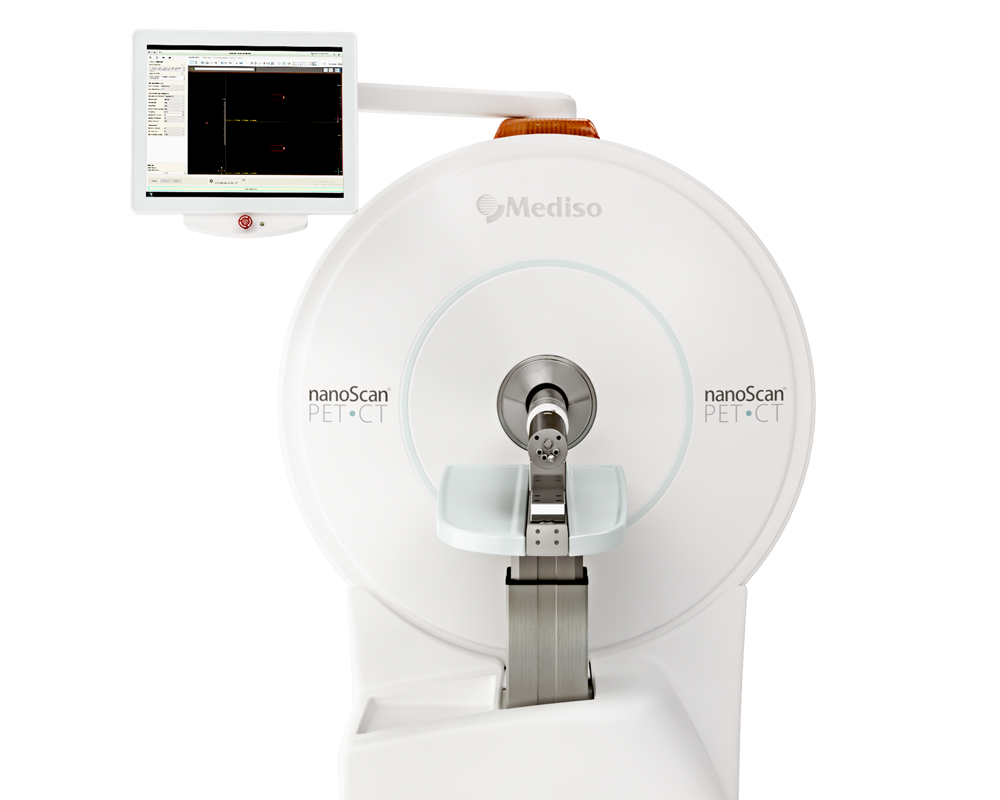
Results from nanoScan® PET/CT
The study investigated how treatment with cotadutide (a GLP‑1R/GCGR dual‑agonist) affected BAT metabolism. To capture these effects in vivo, they used ^18F‑FDG PET imaging, conducted via the nanoScan PET/CT system, at multiple time points (baseline, 14 days, and 28 days).
- PET/CT clearly demonstrated enhanced BAT glucose uptake in animals treated with cotadutide (GLP-1R/GCGR dual agonist) and g1437 (GCGR agonist), starting from day 14 and sustained through day 28.
- Liraglutide (GLP-1R agonist) only showed a modest effect detectable at the later time point (day 28), and only in a subset of mice.
- The magnitude of the response was notably large in BAT compared to other adipose depots.

Fig. 5. Cotadutide increases brown adipose tissue glucose uptake.
Analysis of glucose uptake in DIO mice following 28-day treatment of cotadutide (10 nmol/kg, blue upward triangles), liraglutide (5 nmol/kg, purple downward triangles) (A, B), 10 nmol/kg (C–E)), or g1437 (5 nmol/kg, gold diamonds), compared to vehicle (red circles). Tissue-specific glucose uptake (Rd) in gastrocnemius (Gastroc), vastus lateralis (Vastus L), perigonadal adipose tissue (PG AT), subcutaneous adipose tissue (SubQ AT) (A), soleus muscle, brown adipose tissue (Brown AT), heart, and brain tissue (B). Vechicle (n = 9), cotadutide (n = 8), liraglutide (n = 9), g1437 (n = 8). Reduction in body weight (BW) throughout the 28-day dosing period is shown as % change, with fluorodeoxyglucose (FDG) positron emission tomography (PET) imaging timepoints indicated (C). n = 8 mice per group. Quantification of FDG-PET glucose uptake measurements in brown adipose tissue (BAT) at baseline, day 14, or day 28 of treatment (D). Representative image from FDG-PET studies summarized in (D), (E). n = 8 mice per group, except cotadutide baseline (n = 4), liraglutide D14 (n = 7), g1437 D14 (n = 7). Data shown as the mean ± SEM. In (C), lines below the graph indicate differences compared with a vehicle at each time point and correspond to the respective group color. One-way ANOVA with Tukey’s multiple comparisons post hoc for each tissue (A, B) or each treatment group (D), Two-way ANOVA with Tukey’s multiple comparisons post hoc (C). *p < 0.05, **p < 0.01, ***p < 0.001, ****p < .0001. Exact p values are included in the Source Data file. Source data are provided as a Source Data file.
Hogyan segíthetünk Önnek?
További termékinformációkért, vagy támogatásért keresse szakértőinket!
Vegye fel a kapcsolatot