Sensitive, non-immunogenic in vivo imaging of cancer metastases and immunotherapy response
2023.08.14.
Joseph R. Merrill, Alessandra Inguscio,Taemoon Chung, Breanna Demestichas, Libia A. Garcia, Jill Habel, David Y. Lewis, Tobias Janowitz, and Scott K. Lyons
Cell Stress, 2023 Aug
Abstract
Non-invasive imaging of tumors expressing reporter transgenes is a popular preclinical method for studying tumor development and response to therapy in vivo due to its ability to distinguish signal from tumors over background noise. However, the utilized transgenes, such as firefly luciferase, are immunogenic and, therefore, impact results when expressed in immune-competent hosts. This represents an important limitation, given that cancer immunology and immunotherapy are currently among the most impactful areas of research and therapeutic development. Here we present a non-immunogenic preclinical tumor imaging approach. Based on the expression of murine sodium iodide symporter (mNIS), it facilitates sensitive, non-invasive detection of syngeneic tumor cells in immune-competent tumor models without additional immunogenicity arising from exogenous transgenic protein or selection marker expression. NIS-expressing tumor cells internalize the gamma-emitting [99mTc]pertechnetate ion and so can be detected by SPECT (single photon emission computed tomography). Using a mouse model of pancreatic ductal adenocarcinoma hepatic metastases in immune-competent C57BL/6 mice, we demonstrate that the technique enables the detection of very early metastatic lesions and longitudinal assessment of immunotherapy responses using precise and quantifiable whole-body SPECT/CT imaging.
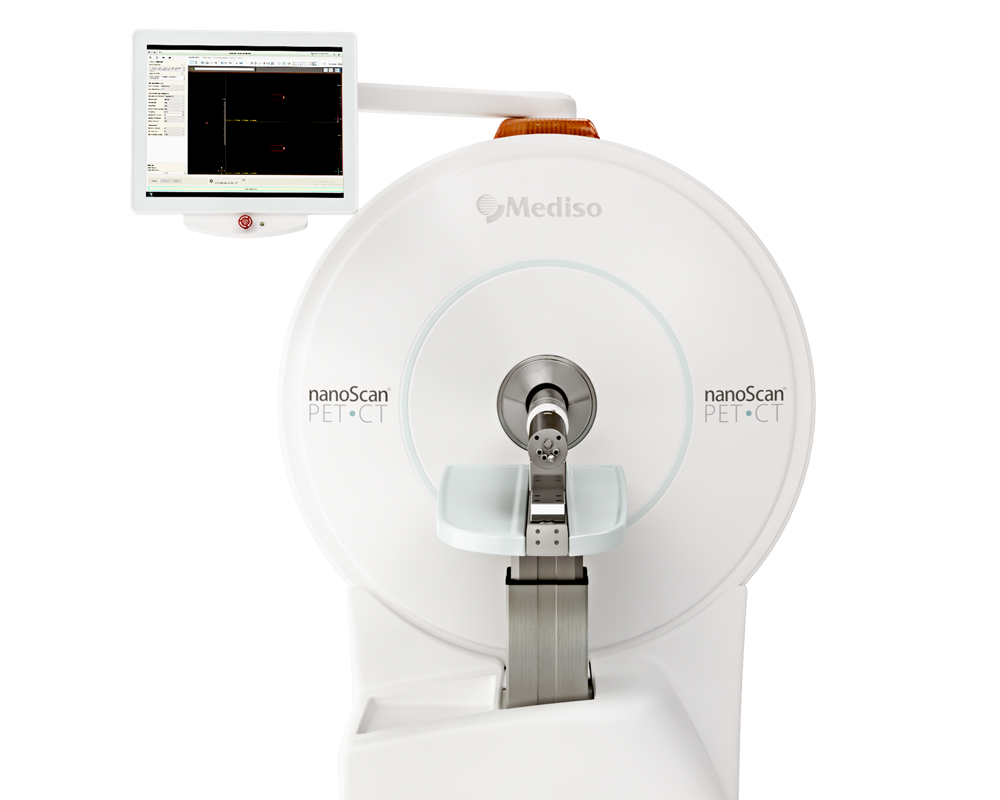
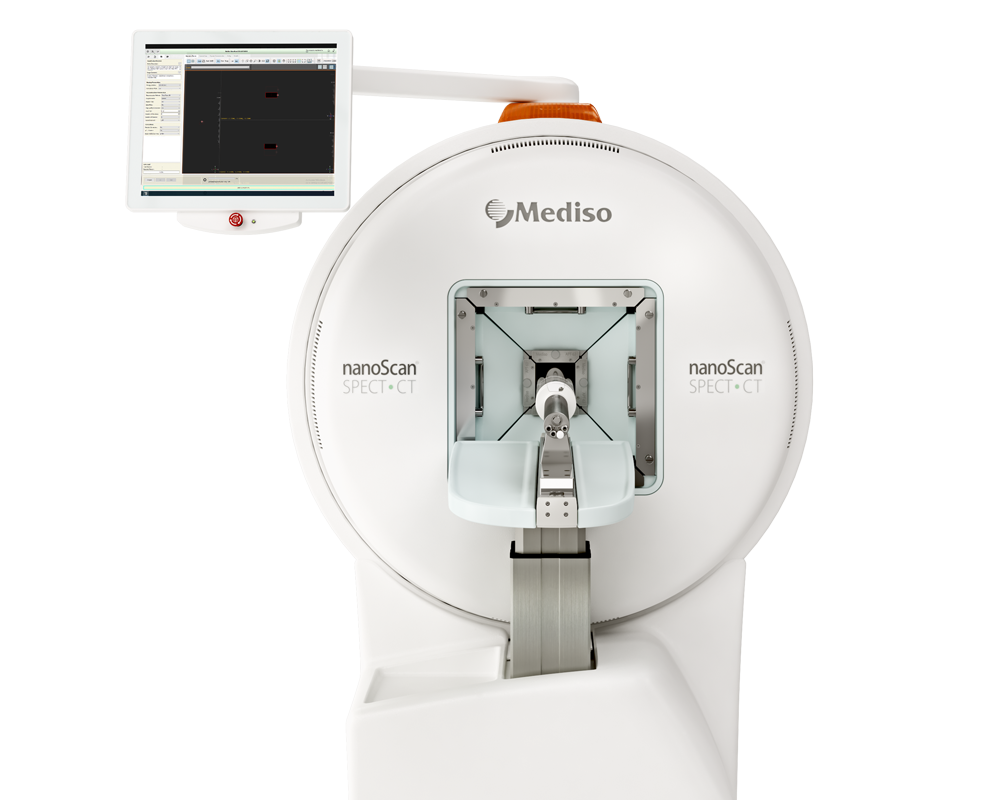
Results from the nanoScan SPECT/CT
mNIS-SPECT imaging offers a number of clear research advantages:
- mNIS expression can be detected by SPECT (with [99mTc]pertechnetate) or PET (with [18F]TFB)
- it offers very high image contrast of tumor lesions relative to normal tissue at most body locations
- gamma radiation is minimally attenuated or scattered by overlying tissue
- NIS-mediated radiotracer uptake is indirectly ATP dependent, therefore necrotic or otherwise non-viable tumor cells will not contribute to signal

FIGURE 3: Detection of metastatic lesions in vivo by mNIS-SPECT.
(A and B) A representative SPECT/CT maximum intensity projection (MIP) and a 2D coronal slice image of metastatic mNIS+/GH-pancreatic tumors developing predominantly in the liver, 5 weeks after tumor cell introduction via the portal vein. Note that the thyroid and salivary glands, stomach and bladder (denoted by green arrows in A) are sites of endogenous NIS expression or probe excretion and do not represent sites of tumor development. (C) Photograph of tumors (yellow arrows) in the liver of the same mouse imaged in A and B, taken 5 days later at necropsy (also see Figures S2 and S3).

FIGURE 4: Treatment response monitoring of metastatic PDAC tumors using mNIS based SPECT/CT.
(A and B) (A) Schematic experimental schedule for tumor implantation, imaging and drug treatment. (B) Coronal SPECT/CT images of representative mice from both experimental groups following implantation with wild-type or (C) KRT19 knockout tumor cells at: study enrollment (leftmost panels, day 15 post-implantation for NR-1 and day 14 for R-1); and following commencement of treatment (on day zero) with αPD-1. ‘S' indicates the stomach (an organ with high endogenous NIS expression). Yellow arrows indicate liver metastases, magenta arrows indicate metastases outside the liver (i.e. in the intestine). Response data for each subject following treatment determined using (D) SUVsum, (E) SUVmax, (F) total apparent volume above 5 SUV threshold and (G) number of liver lesions. Subjects NR-1 – NR-2: sgScramble KRT19 wild-type tumor cells. Subjects R-1 – R-3: sgKRT19 knockout tumor cells.
¿como podemos ayudarlo?
Póngase en contacto con nosotros para obtener información técnica, productos y servicios!
Ponerse en contacto
