18F-FDG PET Biomarkers Help Detect Early Metabolic Response to Irreversible Electroporation and Predict Therapeutic Outcomes in a Rat Liver Tumor Model
2018.04.01.
Xifu Wang et. al
Radiology, 2018
Summary
The aim of the authors was testing the hypothesis that biomarkers of fluorine 18 (18F) fluorodeoxyglucose (FDG) positron emission tomography (PET) can be used for the early detection of therapeutic response to irreversible electroporation (IRE) of liver tumor in a rodent liver tumor model.
Irreversible electroporation (IRE) ablation involves targeted delivery of electrical pulses to induce tissue death by means of cell membrane permeabilization. Most recent studies have shown that IRE induces alterations to the cell membrane in both tumor and normal tissues (nanopores were observed on images from transmission electron microscopy). IRE can ablate large volumes of tissue without inducing thermal effects; this ability offers advantages over existing thermal ablation methods.
At present, no imaging tool is commonly used to assess early metabolic response to IRE therapy.
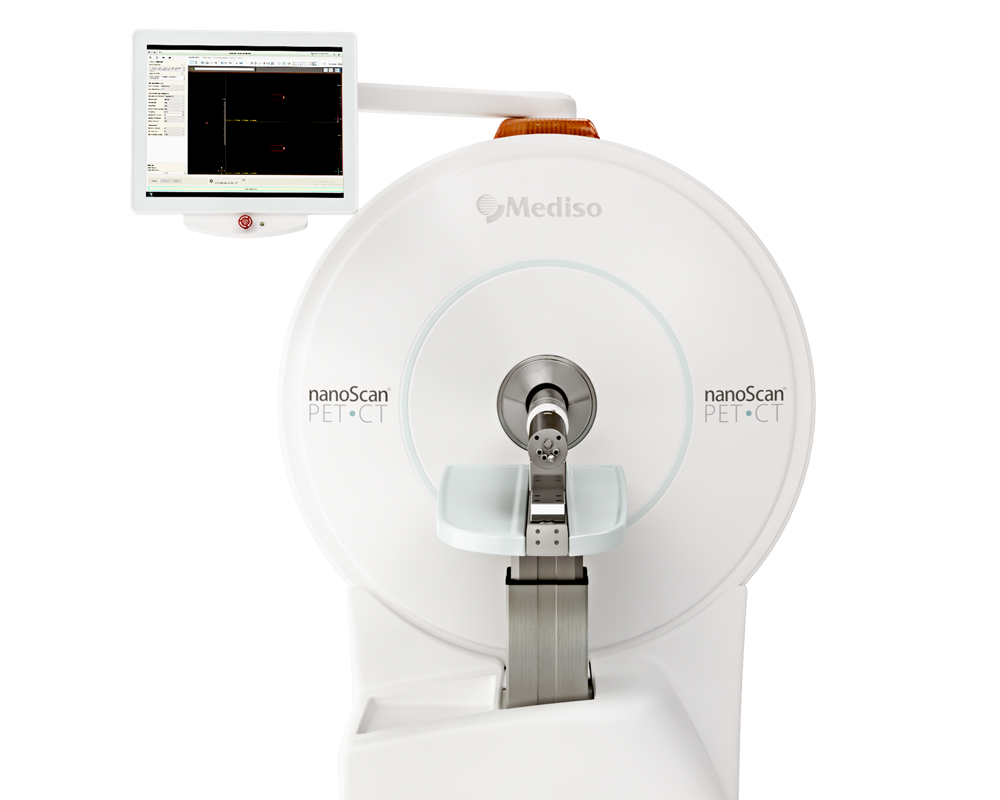
Results from the nanoScan® PET/CT
The rats were fasted for 12 hours before 18F-FDG PET/CT. Each rat was injected through a tail vein catheter with radioactive glucose (18F-FDG, 0.2–0.3 mL). 18F-FDG dose activity administered to the rats was chosen to be 1000 μCi/kg. The animals were placed on a warmed platform for 45 minutes immediately after 18F-FDG injection. The rats were then anesthetized and fixed to a rat-specific holder to undergo PET/CT. Localizer images were obtained by using an integrated x-ray CT camera. A 20-minute static PET scan of the liver was acquired, with a whole-body CT scan acquired immediately after to provide an attenuation map for PET image reconstruction. These PET/CT measurements were performed at baseline and at 3 days after IRE for each animal to assess treatment outcome.
- ΔSUVmax significantly differed between treated and untreated tumors
- There was a strong correlation between ΔSUVmax 3 days after IRE and diameter change 14 days after IRE for the treated tumors (R = 0.66, P = .01), which suggests that the standardized uptake value can be an early biomarker of IRE outcome
- Fluorine 18 fluorodeoxyglucose PET metabolic biomarkers can be used for the early detection of therapeutic response to IRE treatment of liver tumors, which may permit timely adjustments to a patient’s therapeutic regimen as needed to improve clinical outcomes

Fig2. Representative axial, A, D, T1-weighted MR images, B, E, T2-weighted MR images, and, C, F, PET/CT scans obtained at baseline (top row) and 3 days after IRE treatment (bottom row) for 1.0-cm McA-RH7777 tumor (arrow). Tumor signal intensity was lower on T1-weighted images than on T2-weighted images at both baseline and 3 days after IRE. Tumors had substantial initial FDG activity on baseline fused FDG PET/CT images. FDG PET/CT scan obtained after IRE shows limited metabolic activity. In this specific case, SUVmax was 3.75 at baseline and 1.22 at 3 days after treatment.

Fig3. ΔSUVmax 3 days after IRE, ΔDmax 14 days after IRE, and correlation between ΔSUVmax and ΔDmax. A, Box-and-whisker plot shows significant differences in ΔSUVmax between treated and untreated tumors (P < .001). B, Box-and-whisker plot shows significant differences in ΔDmax between treated and untreated tumors (P < .001). C, Graph shows strong correlation between ΔSUVmax 3 days after IRE and ΔDmax 14 days after IRE in treated tumors (R = 0.66, P = .01). D, Graph shows no correlation between ΔSUVmax 3 days after IRE and ΔDmax 14 days after IRE in control (untreated) tumors (R = 0.19, P = .54)
Wie können wir Ihnen behilflich sein?
Bitte kontaktieren Sie uns für technische Informationen und Unterstützung jeglicher Art in Zusammenhang mit unseren Entwicklungen und Produkten.
Kontaktformular
