Comparative evaluation of carbohydrate-based PET tracers for Aspergillus fumigatus imaging
2026.10.15.
Jianhao Lai et al., European Journal of Nuclear Medicine and Molecular Imaging Research, 2026
Summary
Invasive fungal infections remain a major health concern in immunocompromised patients due to late and unspecific diagnosis. Pathogen-specific PET radiotracers such as 2-deoxy-2-[18F]fluorocellobiose (FCB) and 2-deoxy-2-[18F]fluorosorbitol (FDS) have shown potential to distinguish infections. Based on promising in vitro results with L-Rhamnose, it was developed 2-deoxy-2-[18F]fluoro-LRhamnose (F-Rham) as a potential fungal specific ligand. However, direct comparisons across tracers are limited by inconsistent experimental conditions in different institutions.
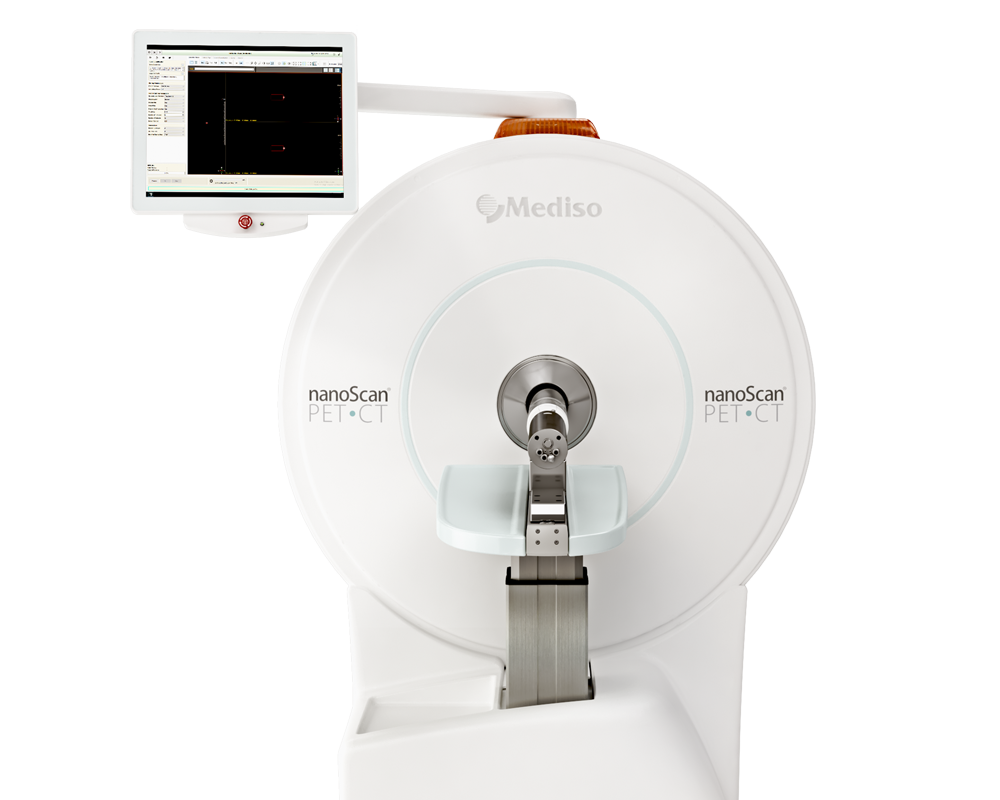
PET/CT imaging with FDG, FCB, FDS and F-Rham, data acquisition and reconstruction was performed using the nanoScan PET/CT (Nucline NanoScan 3.04, Mediso). The imaging and dosing methodology were kept constant across all animals. All mice were intravenously injected with FDG, FCB, FDS and F-Rham (~ 9 MBq) via the tail vein. For static scans, the animals were imaged at 120 min time points after injection of FCB, FDS and F-Rham or 40 min after injection of FDG.
For the consecutive PET imaging studies with FCB and FDS, A. fumigatus-infected animals were divided into two groups. In the first group animals were scanned with FCB on day 3 followed by FDS on day 4, whereas in the second group the order was reversed (FDS on day 3 and FCB on day 4). This design controlled for potential differences due to disease progression.
After reconstruction, the images were checked for quality control using Fusion software (Mediso) and later analyzed using MIM 7.3.3 (MIM Software Inc.). Normal shoulder muscles were used as nontarget tissues for myositis models.
Among the four tested tracers, FCB showed the highest uptake in A. fumigatus in vitro and the highest target-to-non-target ratios in PET imaging of the same murine A. fumigatus myositis model. Unlike FDG, FCB distinguished live infection from heat-killed inoculations. F-Rham did not show specific accumulation at either the live or heat-killed inoculation sites. When comparing FDS and FCB, FCB uptake was higher in A. fumigatus compared to bacterial infections (Escherichia coli (E. coli) and Staphylococcus aureus (S. aureus)), whereas FDS preferentially accumulated in E. coli, both in vitro and in vivo.
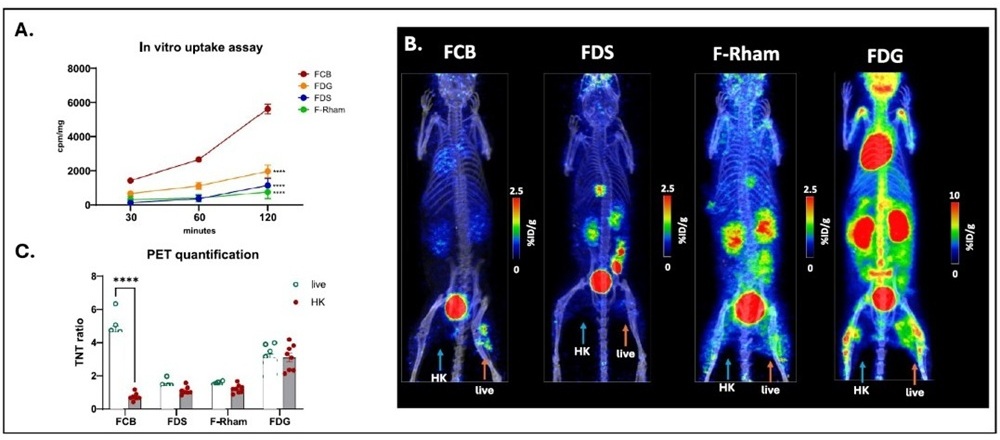
Fig. 2 A: In vitro uptake in A. fumigatus with FCB, FDS, FDG and F-Rham at different time-points. The values represent mean ± SEM from three to eight experimental repeats. At 120 minutes, FCB uptake is significantly higher than that of the other three tracers; B: Representative MIP images of static PET scans of A. fumigatus infected mice comparing FCB, FDS, F-Rham at ~120 min post- tracer injection (p.i). and FDG at ~40 min p.i. Orange arrows indicate site of live infection, and blue arrows indicate heat-killed (HK) inoculation site. Scale bars used for FCB, FDS and F-Rham are identical. The scale bar for FDG was adjusted due to expected high uptake levels in organs and at sites of infection. C: PET quantification of target to non-target (TNT) ratios of four tracers comparing uptake in live and heat-killed inoculation sites.
Fig. 3 A: In vitro uptake of FCB and FDS in A. fumigatus, E. coli and S. aureus at various time-points. The values represent mean ± SEM; Comparing the 120-minute uptake values for FCB; B: Representative MIP images of static PET scans at ~2 hours p.i. comparing in vivo uptake of FCB or FDS in myositis mice inoculated with live and HK A. fumigatus, E. coli or S. aureus. C: PET quantification (%ID/g target to non-target ratio) of FCB or FDS uptake in live and HK sites.
Fig. 4 A: Representative MIP images of static PET scans at ~2 hours p.i. comparing in vivo uptake of FDS (day 3) and FCB (day 4) in the same animal infected with live A. fumigatus in a crossover design. B: Representative MIP images of static PET scans at ~2 hours p.i. comparing in vivo uptake of FCB (day 3) and FDS (day 4) in the same animal infected with live A. fumigatus in a crossover design. C: Graph showing the TNT values for FDS and FCB on respective imaging days. There are significantly higher TNT values in live A. fumigatus for FCB than for FDS across imaging sequences


Conclusion
FCB shows highest accumulation in live A. fumigatus infection, while FDS was preferably taken up by E. coli. Among the tested tracers, FCB showed the most promise for successful detection of live A. fumigatus infection when translated to humans.
Full article on link.springer.com
Comment pouvons-nous vous aider?
N'hésitez pas à nous contacter pour obtenir des informations techniques ou à propos de nos produits et services.
Contactez-nous