Noninvasive Quantification of Glucose Metabolism in Mice Myocardium Using the Spline Reconstruction Technique
2024.07.16.
Alexandros Vrachliotis et al, J Imaging, 2024
The spline reconstruction technique (SRT) is a fast algorithm using a novel implementation of the inverse Radon transform. This study compared SRT with filtered back-projection (FBP) and the Tera-Tomo 3D algorithm using dynamic PET data from seven male C57BL/6 mice. Patlak graphical kinetic analysis quantified the myocardial metabolic rate of glucose (MRGlu), with image analysis performed using PMOD software. Statistical analysis showed no significant differences (p > 0.05) in MRGlu values between SRT, FBP, and Tera-Tomo 3D. SRT performed similarly to other methods, offering a valid alternative for preclinical dynamic PET studies.
Positron emission tomography (PET) is a versatile imaging technique used across various fields, often combined with CT or MRI for enhanced diagnostics. Dynamic PET, particularly with the glucose analog 18F-FDG, enables detailed metabolic analysis, but accurate quantification requires precise image reconstruction. Traditional methods like filtered back-projection (FBP) and iterative techniques such as OSEM are widely used but have limitations in noise, artifacts, and quantification accuracy. The spline reconstruction technique (SRT) offers an alternative approach, reducing streak artifacts and potentially improving the analysis of small or low-contrast regions. This study aims to compare the performance of SRT, FBP, and Tera-Tomo 3D in evaluating myocardial glucose metabolism in mice using dynamic PET data.
Materials and Methods
- Imaging system
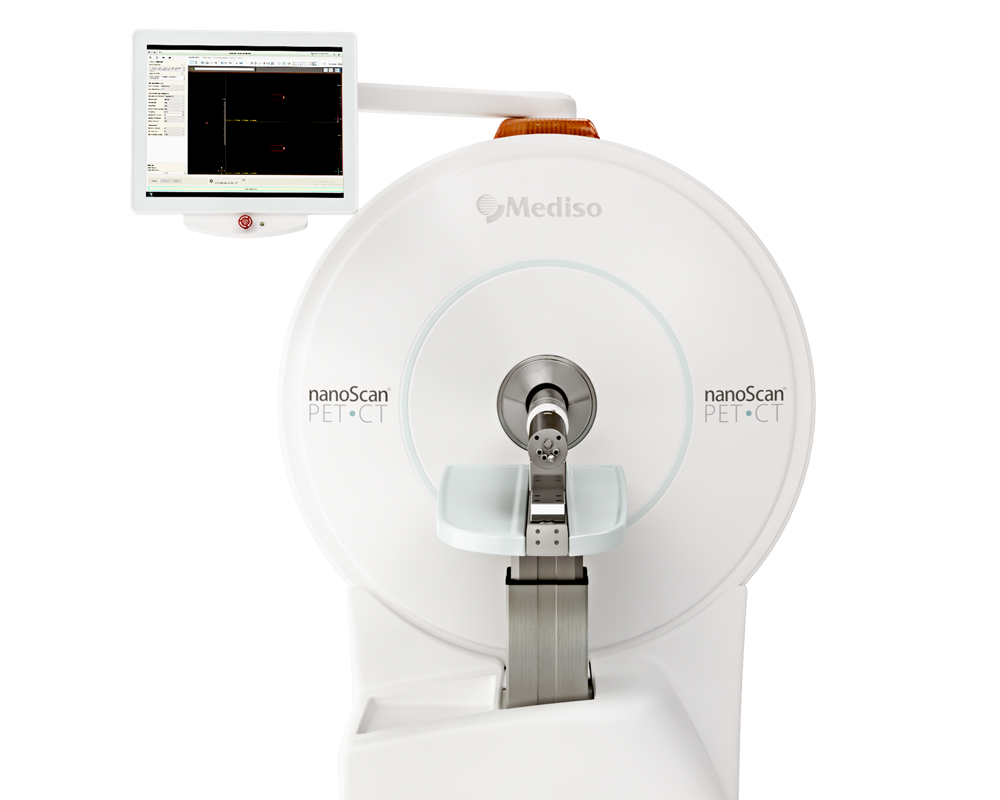
The imaging system utilized in this study was a Mediso nanoScan® PC (PET8/2) PET/CT scanner (Mediso Medical Imaging Systems, Budapest, Hungary). This system features two rings with an inner diameter of 12.6 cm, each ring containing eight detector modules. Each module is composed of 29 × 29 LYSO crystal needles, each measuring 1.51 mm × 1.51 mm × 10 mm. The scanner offers axial and transaxial fields of view of 98.6 mm and 80 mm, respectively. Further technical details of the imaging system can be found in [31].
- Animal Model
Seven healthy, 3-month-old male C57BL/6 mice (n=7), with an average weight of 26.12 ± 1.78 g, were imaged using the described imaging system. The mice were fasted for eight hours prior to imaging, with access to water provided freely. All animals were housed in the Laboratory Animal Facility of BRFAA, adhering to both National and European regulations for the care of animals used in research, as well as the guidelines set by the Association for the Assessment and Accreditation of Laboratory Animal Care (AAALAC).
- PET Imaging
Blood glucose levels were measured from tail vein samples before and after imaging to calculate MRGlu values. The mice were anesthetized with 2% isoflurane in oxygen and kept at a stable body temperature (~36 °C) during the experiment. Each mouse received an average of 8.09 ± 0.99 MBq of 18F-FDG via tail vein injection. Dynamic 60-minute PET scans were conducted, followed by 5-minute whole-body CT scans. The animals' breathing rate and body temperature were continuously monitored throughout the procedure.
- PET Data Acquisition
List-mode PET data were acquired immediately after tracer administration and framed into a dynamic sequence of varying lengths [14]. The Fourier rebinning algorithm (FORE) was used to convert the data into two-dimensional (2D) sinograms for analytic reconstructions, with a maximum ring difference of 16 and an energy window of 400–600 keV. The line-of-response (LOR) blur factor was set to the default value of 30. The sinograms, measuring 284 detectors × 512 angles with 123 image slices and a 0.3 mm bin size, were corrected for attenuation, scatter, randoms, and decay.
- Image Analysis
The Patlak graphical kinetic analysis of the PET-reconstructed images (totaling 202,048 images) was conducted using PMOD software (version 3.506, PMOD Technologies LLC, Fällanden, Switzerland) [35], a recognized reference tool for PET kinetic modeling. For each reconstruction algorithm, manual ROIs were drawn to encompass the entire hot region of the myocardium (tissue). Additionally, a cubic volume of interest (VOI) was defined for the hot value voxels of the IVC (whole blood), as illustrated in Figure 2.

Figure 2. Illustration of the ROIs and VOI defined for the hot region of the myocardium (a) and the hot value voxels of the IVC (b) in a representative male C57BL/6 mouse. The myocardium ROIs were selected using late frames (frames 27–32) of the PET scan, while the IVC VOI was selected using short-duration (2 s) early frames (frames 1–3) of the PET scan. The figure was created via PMOD software [35]. The scalar values in the color bar range from zero (black) to the maximum (white) of the reconstruction algorithm Tera-Tomo 4–13. A = anterior, F = feet, H = head, L = left, P = posterior, and R = right.
The Patlak graphical kinetic analysis of the PET-reconstructed images (totaling 202,048 images) was conducted using PMOD software (version 3.506, PMOD Technologies LLC, Fällanden, Switzerland) [35], a recognized reference tool for PET kinetic modeling. For each reconstruction algorithm, manual ROIs were drawn to encompass the entire hot region of the myocardium (tissue). Additionally, a cubic volume of interest (VOI) was defined for the hot value voxels of the IVC (whole blood), as illustrated in Figure 2.

In this analysis, CP(t) represents the input curve, CT(t) is the measured tissue time–activity curve (TAC), K is the slope, and V is the intercept, with their interpretations based on the underlying compartment model.
For the 18F-FDG model, K equals Ki = (K1×k3)/(k2+k3), and V is the sum of the distribution volume (V0) of the reversible compartment C1 and the fractional blood volume (vB). In systems with irreversible compartments, the plot forms a straight line after equilibration (t∗). The "fit all regions" option in PMOD software was used to apply this analysis uniformly across all regions. Both the slope Ki (mL/ccm/min) and MRGlu (μmol/min/100 g) were automatically calculated, with MRGlu derived from Ki [8] using the following expression:

where BG represents the average blood glucose concentration measured at both the start and end of the scan (mmol/L), and LC is the lumped constant, which is 0.67 as estimated for rodents [14].
6. Statistical Analysis
Statistical significance was assessed using a one-way analysis of variance (ANOVA), assuming data followed a normal distribution. ANOVA tests the null hypothesis that the samples from all groups have the same mean values. The nonparametric alternative to ANOVA is the Kruskal–Wallis test. For comparisons between FBP, SRT, and Tera-Tomo 3D variants, a p-value below 0.05 was deemed statistically significant. All statistical analyses were performed with MedCalc software (version 18.9.1, MedCalc Software Ltd., Ostend, Belgium) [37].
Results from nanoScan® PET/CT
Figures 3 and 4 show PET images reconstructed with the FBP, SRT, and Tera-Tomo 3D algorithms. There were no notable visual differences among images from the seven animals, so only one representative set is shown. Visual inspection revealed minor differences in noise texture, with FBP and SRT images appearing slightly noisier than those from the Tera-Tomo 3D variants, consistent with previous findings [30].

Figure 3. Analytic reconstructions using FBP and SRT. Coronal view of the myocardium (a) and the IVC (b) in a representative male C57BL/6 mouse. The figure was created via PMOD software [35]. The scalar values in the color bar range from zero (black) to the maximum (red) of each reconstruction algorithm.

Figure 4. Iterative reconstructions using the two variants of the Tera-Tomo 3D algorithm, namely, Tera-Tomo 4-5 and Tera-Tomo 4-13. Coronal view of the myocardium (a) and the IVC (b) in a representative male C57BL/6 mouse. The figure was created via PMOD software [35]. The scalar values in the color bar range from zero (black) to the maximum (red) of each reconstruction algorithm.
Tables 1 and 2, and Figures 5 and 6, show that images reconstructed with SRT have higher slope Ki and MRGlu values compared to FBP, while Tera-Tomo 3D variants yield the highest values. Among Tera-Tomo 3D variants, both slope Ki and MRGlu increase with more iterations. ANOVA revealed no significant differences between SRT and FBP, or between Tera-Tomo 4-5 and FBP (p > 0.05). Significant differences (p = 0.011) were found between FBP and Tera-Tomo 4-13, but no significant differences were observed between the two Tera-Tomo 3D variants (p > 0.05).
Conclusions
This paper provides a quantitative comparison of FBP, SRT, and Tera-Tomo 3D with varying iteration numbers using preclinical dynamic PET data. We utilized the STIR library to perform reconstructions of rebinned 2D sinograms with FBP and SRT. Patlak graphical kinetic analysis was applied to assess the algorithms' performance in measuring myocardial glucose uptake in C57BL/6 mice. The results indicate that SRT is comparable to FBP and Tera-Tomo 3D variants, offering a viable analytic method for preclinical dynamic PET imaging. Future research will explore integrating SRT with neural networks to enhance image quality, particularly for early time frames where SRT shows potential benefits.
Full article on ncbi.nlm.nih
Comment pouvons-nous vous aider?
N'hésitez pas à nous contacter pour obtenir des informations techniques ou à propos de nos produits et services.
Contactez-nous