Comparison of [18F]DPA‑814 with [18F]DPA‑714 for TSPO Imaging in an Experimental Model
2026.04.01.
J. van der Bie et al., Molecular Imaging and Biology, 2026
Summary
TSPO-targeted inflammation imaging has gained momentum in studying the pathophysiology of various diseases. The most widely used PET tracer for this purpose is [18F]DPA-714. However its binding affinity can vary vastly among patients; therefore, a potential replacement - such as [18F]DPA-814 - is desired. In this work, cynomolgus and rhesus macaques were enrolled in a longitudinal PET/CT study, in which scans were performed using a Mediso MultiScan™ LFER150 PET/CT. Inflammation was triggered by the SARS-CoV-2 virus. They were injected with [18F]DPA-714 and [18F]DPA-814 tracers at several time points throughout a year. The tracer uptakes were measured and compared in the lungs, brain, liver, kidneys and in the spleen. The results suggested that the [18F]DPA-814 tracer is not affected by polymorphism, but its different kinetics prevent it from being an effective replacement of [18F]DPA-714.
Results from MultiScan™ LFER150 PET/CT
Two healthy, naïve female cynomolgus and two rhesus macaques were scanned dynamically to characterize the kinetics of the [18F]DPA-814 tracer. The animals received intravenous bolus (1–2 ml) of 128.3 ± 19.7 MBq, scanning commenced immediately upon injection and continued for 90 minutes. For the longitudinal portion of the study, four healthy females (aged 8–10 year, weighing 9.4–11.1 kg) were enrolled. They were administered intravenous injection (1–2 ml) of 103 ± 27.3 MBq of [18F]DPA-714 or 179 ± 27.2 MBq of [18F]DPA-814. Three static PET images were acquired of the head, thorax and abdominal area, with scan duration of 10 minutes. All three regions were covered with CT using 80 kV, 720 µA and an exposure time of 0.09 s. TeraTomo 3D reconstruction was applied to the raw PET data using 8 iterations and 9 subsets with voxel size of 0.8 mm. FBP reconstruction of the CT images were performed with Ramlak filter and 321 µm voxel size.
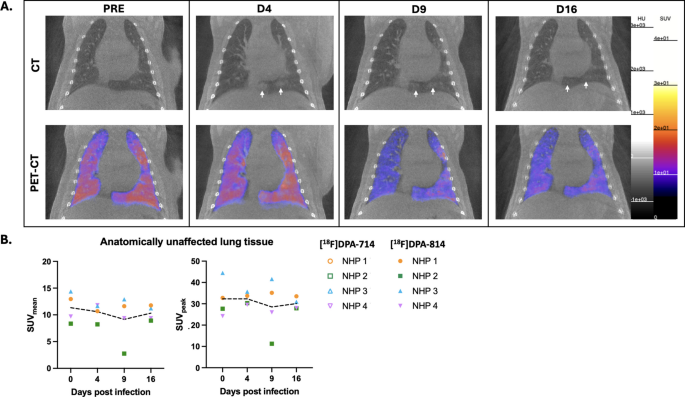
Fig. 1 High pulmonary uptake of [18F]DPA-814 without clear visualization of SARS-CoV-2-induced lesions or inflammation. A. Representative coronal (PET/)CT slices of the development of pulmonary lesions in a macaque. Window-level settings are synchronized. White arrows indicate SARS-CoV-2-induced lesions. B. Development of the SUVmean and SUVpeak in the anatomically unaffected lung tissue over time in the acute phase after SARS-CoV-2 infection. Each symbol represents an individual animal, and the dotted line indicates the average SUVmean or SUVpeak.
Fig. 2 Increased [18F]DPA-714 uptake in the brain following SARS CoV-2 infection. A. Representative sagittal brain PET-CT slices from a macaque. Window-level settings are synchronized. B. SUVmean and SUVpeak values in the whole brain over time during the post-acute phase of SARS-CoV-2 infection. Each symbol indicates an individual animal; open symbols correspond to [18F]DPA-714 imaging and filled symbols to [18F]DPA-814. The continuous line represents the SUVmean and SUVpeak average of [18F]DPA-714, while the dotted line shows the average of [18F]DPA-814.

The CTs revealed pulmonary lesions, but no specific uptake of [18F]DPA-814, whereas [18F]DPA-714 exhibited higher uptake levels. Both SUVmean and SUVpeak for [18F]DPA-814 remained consistent in the lung throughout the observation period, suggesting it may not be ideal for inflammation imaging. Furthermore, the lower uptake of [18F]DPA-814 relative to [18F]DPA-714 was clearly apparent on the brain images.
How can we help you?
Don't hesitate to contact us for technical information or to find out more about our products and services.
Get in touch