Time-of-flight and black-blood MRI to study intracranial arteries in rats
2024.01.09.
Anne F. Cayron, Olivia Bejuy et al. 2024, European Radiology Experimental
Summary
Magnetic resonance imaging (MRI) has revolutionized patient care for cerebrovascular diseases. Recent MRI developments allow for arterial wall characterization, quantification of intravascular flow, studies toward the natural history of the disease, and evaluation of treatment benefits. Neurovascular examinations are commonly performed using time-of-flight (TOF) MRI sequences. Intravenous injection of paramagnetic gadolinium chelates improves the contrast between the arteries and their surrounding tissues. Such contrast-enhanced magnetic resonance angiography is used to assess atherosclerotic disease, vascular dissection, and intracranial aneurysms (IAs) . Vessel wall MRI is performed using a double inversion-recovery black-blood (BB) sequence that suppresses the signal from the blood and the cerebrospinal fluid to highlight the arterial wall. Vessel wall pathology is brought out by comparison of images obtained before and after contrast agent injection, firstly to assess atherosclerotic lesions. Atherosclerotic plaques showing contrast enhancement were histologically characterized by the presence of inflammatory cells, neo-vascularization, or intraplaque hemorrhage.
In recent years, vessel wall MRI was also used to evaluate IAs, which are local outpouchings of cerebral arteries affecting 3 to 5% of the general population. Most of the IAs are asymptomatic and incidentally detected. The major risk is their rupture associated with a high level of morbidity and mortality. The first use of vessel wall MRI in the context of IAs was performed to identify the culprit aneurysm for subarachnoid hemorrhage.
More recently, studies performed in humans suggest that observation of aneurysm wall enhancement (AWE), which corresponds to the presence of a certain amount of gadolinium chelate in the aneurysm wall (Fig. 1a–c), is a sign of IA wall instability. Three hypotheses are currently proposed to explain AWE in human IA walls, i.e., the excessive infiltration of phagocytes that would absorb the contrast agent (Fig. 1d, e), a compromised endothelial barrier integrity leading to contrast leakage from the lumen into the arterial wall (Fig. 1f, g), and/or detection of the contrast agent circulating in adventitial vasa vasorum (Fig. 1h, i). In clinical practice, the definition of AWE is based on four grades: (0) no or questionable focal AWE; (1) focal thick (> 1 mm) AWE; (2) thin (≤ 1 mm) circumferential AWE; and (3) thick (> 1 mm) circumferential AWE.
Although the BB imaging technique has furthered the visualization of the wall of intracranial vasculature facilitating clinical diagnosis, the meaning of AWE is not completely unraveled. To safely use AWE as a reliable diagnostic marker for IA instability, there is a need to deeply understand its meaning. To link the different stages of the aneurysmal disease to the different grades of AWE, it is necessary to monitor the disease during its progression from IA initiation, via growth to rupture. For ethical reasons, such a complete follow-up approach cannot be performed in humans and requires the use of preclinical animal models, more particularly rats, to follow the disease progression longitudinally. Until now, no BB sequences have been developed to study IA development in rats. As a first step in sequence development, the authors' aim was to improve a three-dimensional (3D)-TOF sequence and to develop a BB sequence on a preclinical 3-T MRI to image accurately the anatomy of intracranial vessels in rats.
The authors herein show that our 3D TOF sequence allows for reliable measurements of intracranial artery diameters, inter-artery distances, and angles between arteries, and they report the first BB sequence to be used in rats to study intracranial arteries.
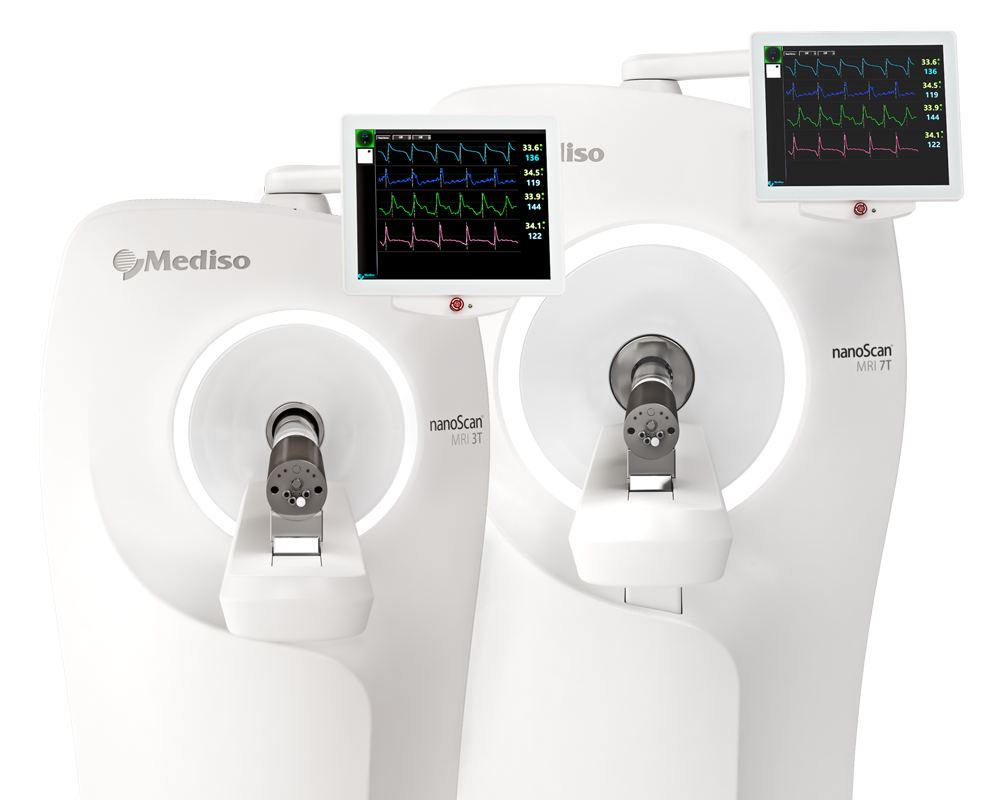
Results from the nanoScan MRI 3T
For the imaging studies, rats were anesthetized with 4% isoflurane. A catheter prefilled with NaCl/heparin was introduced into the tail vein to allow for contrast agent injection. Rats were placed in prone position in the MRI bed (MultiCell rat Brain Imaging Chamber, Mediso Medical Imaging Systems, Budapest, Hungary, Fig. 2a, b), and an ocular gel was applied to avoid dryness. A respiratory probe was placed under the rib cage to monitor breathing (Pneumatic sensor, Mediso Medical Imaging Systems, Budapest, Hungary). Animals were imaged with a 3-T nanoScan® MRI (Mediso Medical Imaging Systems, Budapest, Hungary), equipped with a 100% cryogen-free superconducting magnet with 170-mm bore size. The experiments were conducted with a dedicated brain quadrature radiofrequency coil having an inner diameter of 48 mm (Rat head coil 3.0T, Mediso Medical Imaging Systems, Budapest, Hungary). During imaging, anesthesia was set to 2−3% isoflurane to keep breathing frequency around 60 breaths/min, and body temperature was maintained at 37 °C by a flow of warm air.
Three sequences were performed:
1) 3D-TOF gradient-echo sequence with flow compensation (8 excitations; repetition time 15.1 ms; echo time 6.2 ms; flip angle 40°; in-plane resolution 0.200 × 0.250 mm; field of view in z axis 38 slices × 0.2 mm; slab thickness 7.6 mm; no slice gap; imaging time 12 min (Fig. 2c))
2) BB double-inversion-recovery spin-echo sequence (12 excitations; repetition time 1,200 ms; inversion time 400 ms; echo time 8.2 ms; echo train length 4; echo spacing 8.22 ms; matrix 360 × 340; in-plane resolution 0.100 × 0.141 mm; field of view in z axis 16 slices × 0.6 mm; slab thickness 9.6 mm; no slice gap; imaging time 30 min (Fig. 2d))
3) Same BB sequence after gadolinium-based contrast injection (Dotarem®, Guerbet AG Zurich, Switzerland) via the tail vein catheter (0.6 mmol/kg; manual injection)
As on Figure 3., 3D-TOF images allowed to clearly distinguish the right and left bifurcation sites of the ACA and OA and of the internal carotid artery (ICA) and middle cerebral artery (MCA). The two 3D-TOF examples (Fig. 3a, c) show that ramifications of the arterial tree (i.e., anatomical variations) observed under microscope (Fig. 3b, d) can also be clearly seen with our TOF images.Measurements of arterial diameters performed on TOF (Fig. 3e) and microscope (Fig. 3f) images were very similar. The average ratio of measurements made on TOF to microscope images was 1.10 ± 0.21 (mean ± standard deviation), which represents an absolute difference of 0.05 ± 0.04 mm between TOF and microscope images. Distances measured between the right and left MCA bifurcations also showed a perfect correlation between the measurements done on TOF (Fig. 3g) and microscope (Fig. 3h) images. The average ratio of TOF to microscope images for distances was 1.09 ± 0.01, which corresponds to a difference between the two modalities of less than 10%. On the 3D-TOF images, as shown in Fig. 3i, the measures of angles defined in the “Methods” section according to Ikedo et al. were as follows: left PD angle 26°; right PD angle 25°; left DD angle 34°; and right DD angle 30°.
Figure 4a and b show TOF coronal and axial views of the OA-ACA right and left bifurcations. BB axial views before and after contrast injection are shown in Fig. 4c and e, respectively. The good superposition of TOF and BB axial view before and after Gadolinium injection is shown in Fig. 4d and f, respectively.
- The authors report the first BB-MRI sequence to visualize intracranial arteries in rats using a preclinical 3-T MRI unit. This sequence could be useful for a large community of researchers working on intracranial arterial diseases.
- They have developed a black-blood MRI sequence to study vessel wall enhancement in rats with possible application to understanding IAs instability and finding reliable markers for clinical decision-making.
W czym możemy pomóc?
Skontaktuj się z nami aby uzyskać informacje techniczne i / lub wsparcie dotyczące naszych produktów i usług.
Napisz do nas