Performance of nanoScan PET/CT and PET/MR for quantitative imaging of 18F and 89Zr as compared with ex vivo biodistribution in tumor-bearing mice
2021.06.12.
Marion Chomet et al., 2021, EJNMMI Res.
Abstract
Traditionally, ex vivo biodistribution studies involve sacrificing animals, which raises ethical concerns. Preclinical PET imaging enables longitudinal studies, reducing animal use while offering insights into tracer uptake's whole-body distribution and heterogeneity.Despite available preclinical PET cameras, they are often underutilized for quantification of radiotracer biodistribution. Standardized protocols are lacking, leading to unreliable data and difficulties in comparing studies. Recent evaluations have highlighted variability due to camera type, animal handling, image acquisition, and user differences.Limited comparison between in vivo PET and ex vivo data exists. The partial volume effect (PVE) hampers accurate quantification due to limited spatial resolution, leading to underestimation in small regions.This study assessed a Mediso nanoScan PET/CT and PET/MR (Mediso Ltd., Hungary) scanner's performance in quantifying subcutaneous tumors and selected organs. They used phantoms with common PET radionuclides to evaluate linearity, recovery coefficient, PVE, and spill-over effects. Furthermore, also quantified [18F]FDG and [89Zr]Zr-DFO-NCS-trastuzumab uptake in tumors and organs (brain, kidney, liver) in breast cancer mice through PET imaging and ex vivo biodistribution. Finally compared the results using Bland–Altman plots.
Results with nanoScan PET/CT and PET/MRI
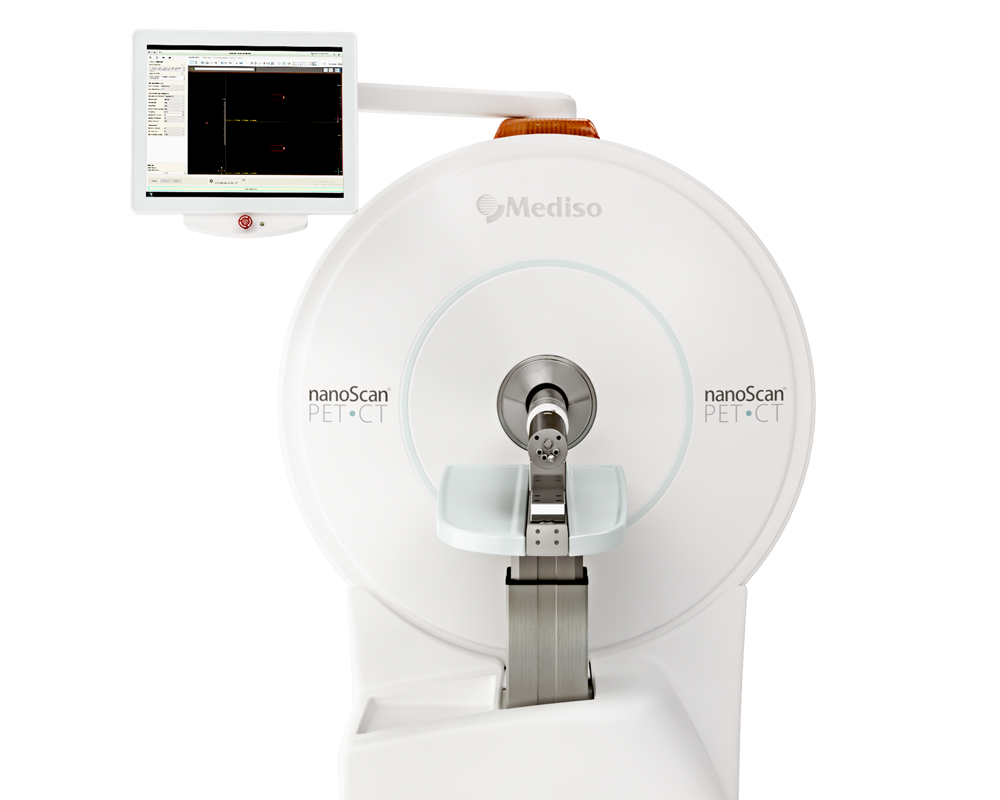
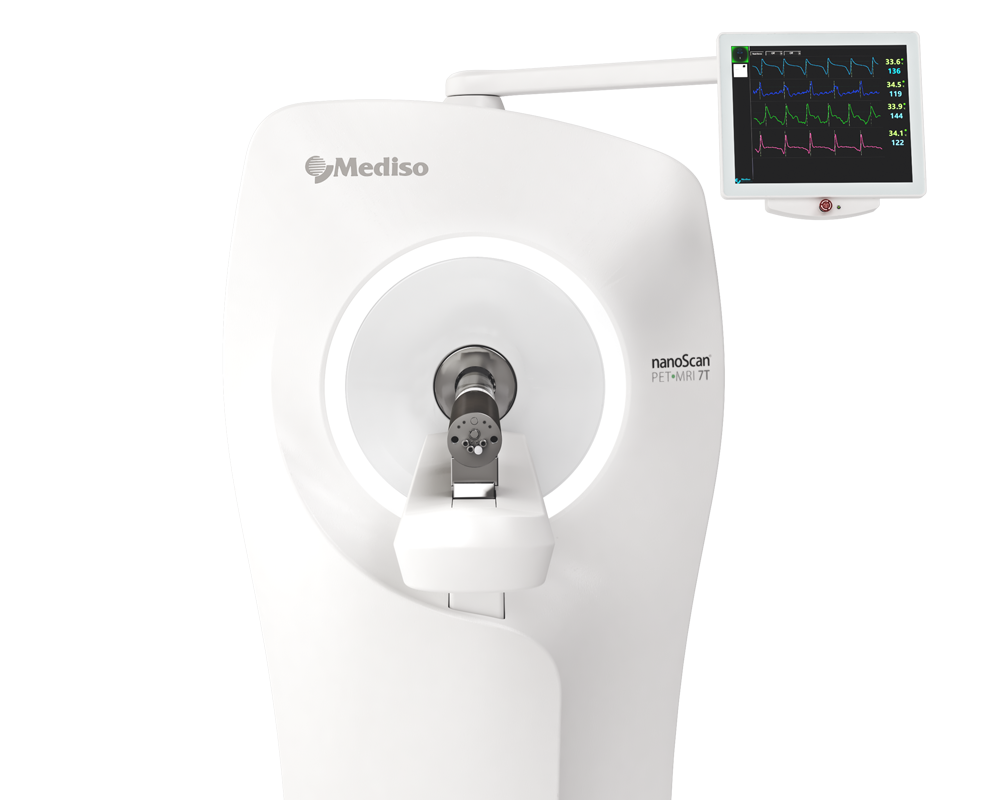
Mediso nanoScan PET/CT and PET/MR systems were used for the phantom experiments. Two NEMA NU 4–2008 phantoms containing carbon-11 ([11C]acetate), gallium-68 ([68Ga]GaCl3 in 0.1 M HCl), fluorine-18 ([18F]FDG), and filled with solutions containing zirconium-89. ([89Zr]Zr-DFO-NCS-trastuzumab). For the animal experiments, athymic nude Foxn1nu/nu mice (n=30) were used and breast cancer cells (2.5x10^6 HER2-positive N87 cells) were injected subcutaneously in both sides when the average tumor size was 100 mm^3. In the study, 20 mice participated in the 18-F study and 10 mice in the 89-Zr study.
During the 18F-FDG study, 20 mice received intravenous 18F-FDG injections (14.3 ± 0.7 MBq) under anesthesia. PET imaging followed a 50-minute incubation, with CT and MR scans preceding PET. After PET imaging, the animals were euthanized for biodistribution. In the [89Zr]Zr-DFO-NCS-trastuzumab study, 10 mice were intravenously injected with the radiolabeled antibody (5.4 ± 0.2 MBq). PET scans were performed at 72 hours post-injection, first in the PET-CT and then in the PET/MR. Mice were euthanized immediately after the last PET scan for biodistribution assessment. In the ex vivo biodistribution process, blood, tumors, and selected organs were collected and weighed. Radioactivity in each sample was measured using a γ-counter, with care taken during tissue collection to remove surrounding tissues and ensure complete organ collection. Radioactivity uptake in each organ was calculated as %IA/g and decay-corrected to the time of PET imaging, facilitating more accurate data interpretation.
The total injected activity, as determined by whole-animal ROI in PET imaging, closely matched the activity derived from the dose calibrator. The ratio of PET/[18F]FDG injected activity was 1.03 ± 0.04 for PET/CT and 1.01 ± 0.08 for PET/MR. Additional biodistribution results can be found in Additional file 1: Table S3. The correlation between image-assessed tumor size and ex vivo tumor weights was strong, with R2 values of 0.90 for PET/CT and 0.88 for PET/MR in the [18F] study. In the [89Zr] study, with smaller average tumor size, the R2 values were slightly lower at 0.84 for PET/CT and 0.75 for PET/MR (the same group of mice was imaged in both cameras before ex vivo biodistribution).

Fig.3. Bland–Altman plots comparing tumor uptake of [18F]FDG (A, B) and [89Zr]Zr-DFO-NCS-trastuzumab (C, D) assessed by PET imaging (PET/CT: A, C; PET/MR: B, D) or by ex vivo biodistribution. The middle-dotted line shows the Bias (mean of the ratios) and the upper and lower dotted lines show the 95% limits of agreement. Average (%IA/g) corresponds to the average uptake value per animal between PET and ex vivo biodistribution

Fig.4. Linear regression plots showing the correlation between tumor uptake assessed by PET imaging (PET/CT: A, C; PET/MR: B, D) and ex vivo biodistribution for [18F]FDG (A, B) and [89Zr]Zr-DFO-NCS-trastuzumab (C, D)

Tab.1. Bland–Altman results for the comparison of tracer uptake quantification (%IA/g) assessed by PET imaging and by ex vivo biodistribution for [18F]FDG and [89Zr]Zr-DFO-NCS-trastuzumab
-
In both the [18F]FDG and [89Zr]Zr-DFO-NCS-trastuzumab studies, PET/CT and PET/MR showed comparable tumor uptake, but this uptake was slightly lower than ex vivo biodistribution results.
-
The bias (PET/ex vivo) was 0.88 ± 0.11 and 0.91 ± 0.11 for the PET/CT and PET/MR in the [18F]FDG study, with relatively large 95% agreement intervals.
-
In the [89Zr]Zr-DFO-NCS-trastuzumab study, the bias PET/ex vivo was slightly worse (0.76 ± 0.03 for PET/CT and 0.78 ± 0.06 for PET/MR), but the standard deviation between the quantification methods was small with narrow 95% agreement intervals.
-
Brain uptake of [18F]FDG showed a PET/ex vivo bias of 1.07 ± 0.03 with a narrow 95% agreement interval for PET/CT, while PET/MR had a larger agreement interval (0.83–1.23).
-
Kidney and liver results demonstrated similar overall bias and 95% agreement intervals for both PET/CT and PET/MR in both [18F]FDG and [89Zr]Zr-DFO-NCS-trastuzumab studies.
In a conclusion, this study compared preclinical PET imaging with ex vivo biodistribution, demonstrating comparable results within certain limits depending on the organ and radioisotope. This supports the potential of quantitative PET imaging as a substitute for ex vivo biodistribution, but further research is needed to assess its applicability across different isotopes and organ types. Improvements in PET scanner technology and comprehensive protocol reporting are essential for enhanced quantification and result reproducibility.
Full artice on ncbi.nlm.nih.gov
W czym możemy pomóc?
Skontaktuj się z nami aby uzyskać informacje techniczne i / lub wsparcie dotyczące naszych produktów i usług.
Napisz do nas