The comparison of attenuation factor of 99mTc and 153Sm radionuclides in planar image using Mediso InterViewTM XP and ImageJ
2023.06.01.
Adni et al., Journal of Medical Physics and Biophysics, 2023
Abstract
Planar imaging quantification is a method in internal dosimetry studies that is needed in the preparation and post-therapy evaluation stages. The attenuation factors are needed in Conjugate View Method to obtain accurate image quantification results. In nuclear medicine installation, the high workload of integrated software slows the quantification process, so it is necessary to advance alternative software that is portable and has high accuracy. This study aims to compare the result of attenuation factors using InterViewTM XP and ImageJ plug-in software. The study was conducted by observing attenuation of 99mTc and 153Sm, which have 1, 2, 4, and 25 mCi activities on water slabs phantom with thickness variations of 1–10 cm using a Mediso AnyScan® S equipped with Low-Energy High-Resolution collimator. Radionuclides activity measurement was performed using a dose calibrator. The energy window of each radionuclide is adjusted to the spectrum range in the gamma camera software. Image quantification was executed with InterViewTM XP and ImageJ plug-in software. The attenuation factor is obtained by plotting a graph between count versus slab thickness. Analysis result using InterViewTM XP and ImageJ software sequentially is 0.140 ± 0.007 cm-1, 0.140 ± 0.009 cm-1 (99mTc), and 0.128 ± 0.004 cm-1, 0.128 ± 0.004 cm-1 (153Sm) at activity range 1–25 mCi. The result of Paired Samples t-test between ImageJ towards integrated InterViewTM XP software shows that the value of Significance (2-tail) > α; thus, H0 is accepted. It is concluded that ImageJ software is quite accurate in determining the value of attenuation factors.
Methods
This study carried out radionuclides source preparation, image acquisition, software development, image quantification using integrated software InterViewTM XP (Mediso, Hungary), ImageJ (NIH, US), and statistical analyses with SPSS. Radionuclides preparation started with a dilution of Natrium Chloride (NaCl) and 99mTc or 153Sm radionuclide with the small activity. Radionuclides with different activities were filled in a small syringe to get the point source image. The radionuclide activity was measured with Dose Calibrator Comecer IBC Lite. A gamma camera Mediso Dual Head AnyScan S Series AS-105061-S was used with planar imaging protocol. The source activity range of radionuclides is 1, 2, 4, and 25 mCi in 99mTc and 153Sm. The image acquired by the gamma camera is a two-dimensional (2D) image. The accuracy of planar imaging is higher than SPECT in the imaging quantification process for determining radiation doses. Radionuclide sources with gamma energy 140 keV (99mTc) and 103 keV (153Sm) were applied for this experiment. Hence, a parallel Low Energy High Resolution (LEHR) collimator is utilized to maximize sensitivity and image resolution. Water slabs phantom with varying thicknesses of 1 – 10 cm functioned as attenuators, which has a human equivalent density and a more manageable setup process than water slabs phantom.
The reconstructed image was analyzed using InterViewTM XP, integrated software from gamma camera Dual Head AnyScan S Series AS-105061-S by Mediso. InterViewTM XP is capable of evaluating planar, whole body, and SPECT imaging. The count value of the image is taken by positioning the Rectangular Region of Interest (ROI) at the point source. The image quantification process is also executed with ImageJ software. This software is developed to read count in Rectangular ROI, equivalent to integrated software InterViewTM XP. The count value in the ImageJ design was conducted by utilizing the RawIntDen function that could provide a total pixel value of intensity on an image with a predetermined ROI area.
The average natural logarithm count per second (CPS) was calculated from the count value from the quantification result using integrated InterViewTM XP and ImageJ Software divided by the acquisition time (60 seconds). Then a graph was plotted to show the relationship between the average result from the natural CPS logarithm and the thickness of the attenuator. The gradient of the graph is an attenuation factor in the quantification results of each software. The results of the attenuation factor obtained from the analysis using integrated InterViewTM XP and ImageJ plug-in software were compared by conducting a paired sample t-test with α = 0.05.
Results
Images as acquisition results were quantified using InterViewTM XP and ImageJ plug-in which are used to determine the count per second value for every image with varying attenuator thickness 1 – 10 cm from each activity.

Comparison of Attenuation Factor in InterViewTM XP and ImageJ Software

Attenuation factor (a) 153Sm 1,7 mCi and (b) 99mTc 1,07 mCi

Normality Test Shapiro-Wilk

Paired Sample t-test
Conclusion
ImageJ plug-in software can be used as an alternative software that is accurate, portable, and easy to perform image quantification. It can be a solution to reduce integrated InterViewTM XP software workloads. Based on the paired sample t-test on the attenuation factor value obtained from the quantification process of integrated InterViewTM XP and ImageJ plug-in software, it can be concluded that there is no significant difference in the results of image quantification using the two softwares.
Full article on Journal of Medical Physics and Biophysics.
-
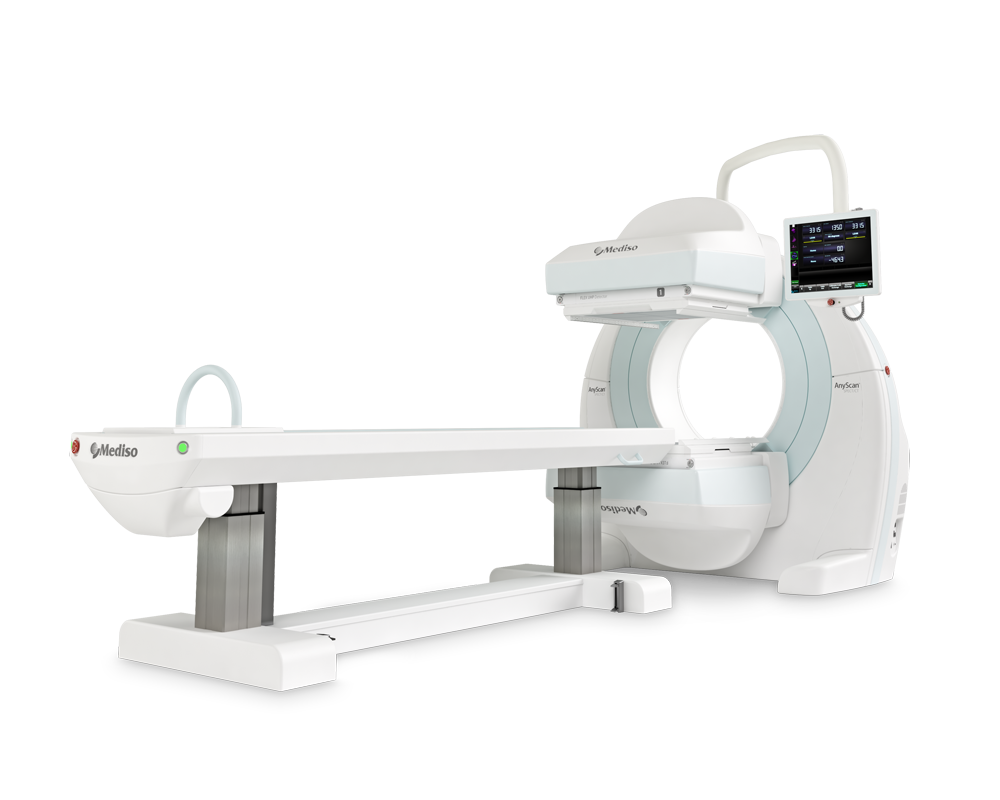
AnyScan® DUO SPECT
Flexible system for all SPECT, Whole-Body & Planar examinations
-
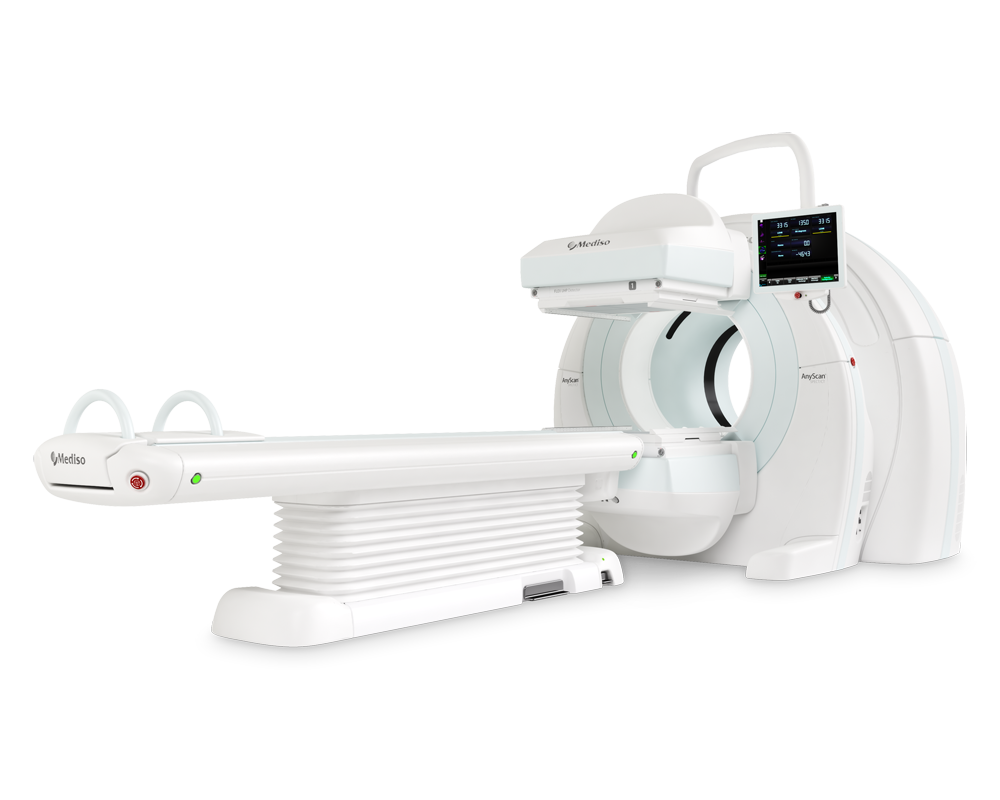
AnyScan® DUO SPECT/CT
Complete solution for daily routine Nuclear Medicine imaging, covering hybrid an...
-
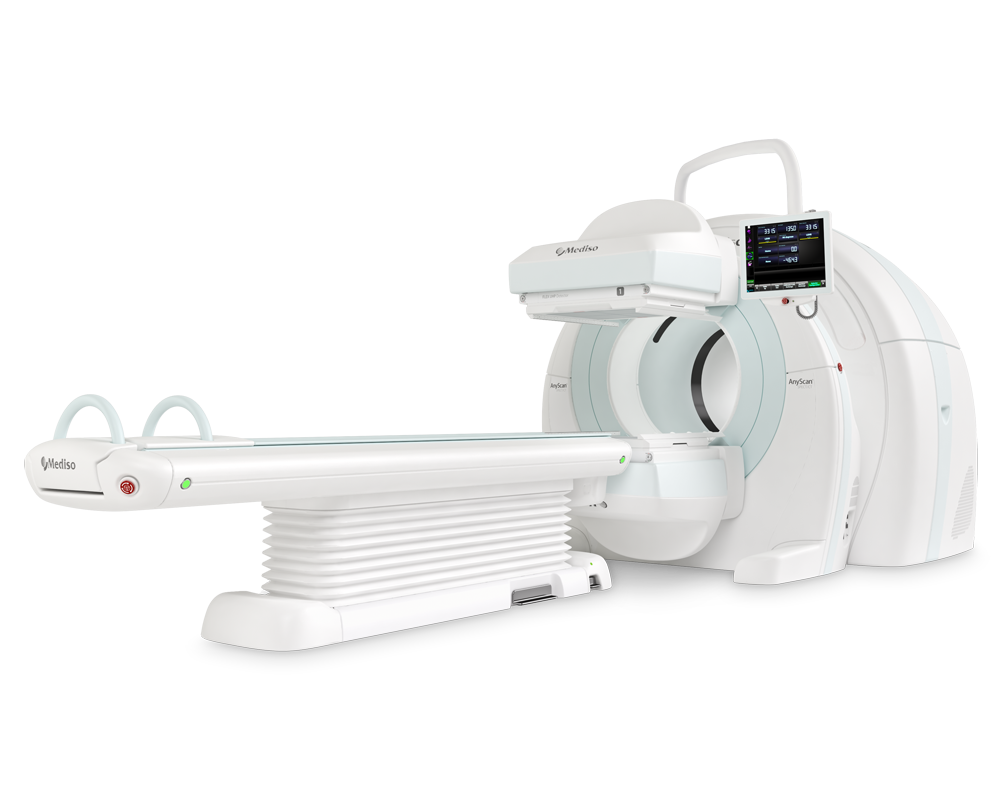
AnyScan® DUO SPECT/CT/PET
An integrated dual-detector SPECT/CT and PET/CT system in a single room installa...
-
Oprogramowanie do przetwarzania InterView™ XP
Oprogramowanie do przetwarzania obrazów planarnych, Whole Body i SPECT


W czym możemy pomóc?
Skontaktuj się z nami aby uzyskać informacje techniczne i / lub wsparcie dotyczące naszych produktów i usług.
Napisz do nas