IL-10 suppresses T cell expansion while promoting tissue-resident memory cell formation during SARS-CoV-2 infection in rhesus macaques
2022.09.13.
Christine E. Nelson,.., Laura E. Via, Daniel L. Barber et. al
bioRxiv preprint, 2022 SEPT
ABSTRACT
The pro- and anti-inflammatory pathways that determine the balance of inflammation and viral control during SARS-CoV-2 infection are not well understood. Here we examine the roles of IFNγ and IL-10 in regulating inflammation, immune cell responses and viral replication during SARS-CoV-2 infection of rhesus macaques. IFNγ blockade tended to decrease lung inflammation based on 18FDG-PET/CT imaging but had no major impact on innate lymphocytes, neutralizing antibodies, or antigen-specific T cells. In contrast, IL-10 blockade transiently increased lung inflammation and enhanced accumulation of virus-specific T cells in the lower airways. However, IL-10 blockade also inhibited the differentiation of virus-specific T cells into airway CD69+CD103+ TRM cells. While virus-specific T cells were undetectable in the nasal mucosa of all groups, IL-10 blockade similarly reduced the frequency of total TRM cells in the nasal mucosa. Neither cytokine blockade substantially affected viral load and infection ultimately resolved. Thus, in the macaque model of mild COVID-19, the pro- and anti-inflammatory effects of IFNγ and IL-10 have no major role in control of viral replication. However, IL-10 has a key role in suppressing the accumulation of SARS-CoV-2-specific T cells in the lower airways, while also promoting TRM at respiratory mucosal surfaces.
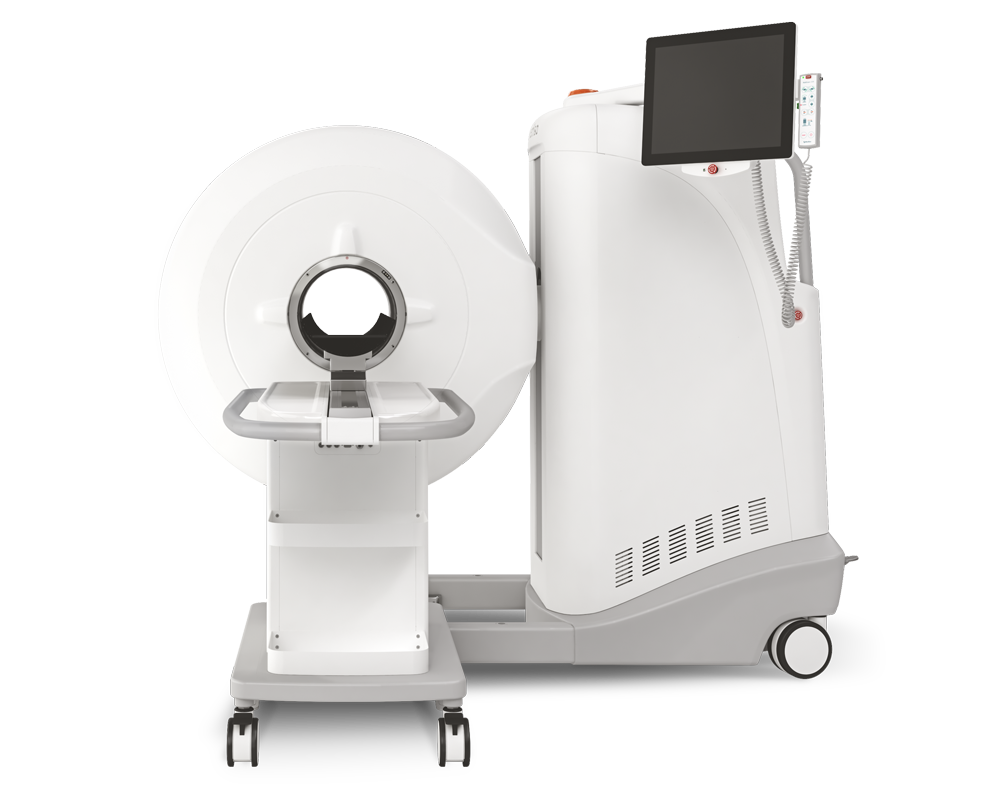
Results from MultiScan™ LFER PET/CT
- IL-10 limits the intensity and duration of lung lesions observed with 18FDG-PET/CT imaging as well as serum markers of inflammation
- IFNγ promoted the intensity and duration of lung lesions observed with 18FDG-PET/CT imaging
- Despite these changes in pulmonary inflammation, neither cytokine blockade substantially altered the kinetics of viral replication or peak viral RNA loads

Figure 1. SARS-CoV-2 induced lung inflammation is increased with IL-10 blockade and decreased with IFNγ blockade.
(A) Experimental design: Fifteen male rhesus macaques in three treatment groups: IgG isotype control, anti-IL-10, or anti-IFNγ (rmIFNγR1-Ig), with n=5 per group. Animals were treated with 10mg/kg of monoclonal antibody i.v. one day prior to infection and three days after infections with SARS-CoV-2/USA/WA-1 at a dose of 2×10⁶ TCID50, administered intranasal (i.n.) and intratracheal (i.t.). (B) 3D rendering of representative lung 18FDG-PET/CT images from baseline and 6 post infection from isotype control animal DHDI. (C) Number of lesions per animal (left axis, points) and average number of lesions per group (right axis, grey bars). Significance calculated with individual t-test with Welch’s correction for lesions per animal. (D) Quantification of FDG uptake in standard uptake value (SUV) normalized to muscle, and volume of individual lesions (size of dot), based on volume of interest (VOI) > −550 Hounsfield units (HU) defined at days 2 or 6 post-infection. Significance calculated with individual t-test with Welch’s correction for FDG uptake at day 6 between groups and Tukey’s multiple comparison test of day 2 vs. day 6 within each group. (E) Lesion score for individual lesions calculated as the sum of normalized max FDG uptake, normalized max Hounsfield’s units, and normalized max volume. Significance calculated with Dunn’s multiple comparison test. (F) Example PET/CT images showing pulmonary lymph node FDG signal from baseline, day 2, 6, 10, and 21-24 post infection from isotype control animal DHNC. Orange arrows indicate lymph nodes and blue arrows indicate lung lesions. (G) Quantification of metabolic activity of lymph nodes as measured FDG uptake in SUV, normalized to muscle. All timepoints post-infection were statistically significant over baseline by 2-way ANOVA and Tukey’s multiple comparison test. (H) Example PET/CT images with evidence of FDG signal from spleen, nasal turbinates, and tonsils from baseline and day 6 post infection. Animal IDs are embedded in image. DHBA and DHNC (isotype). DHMC (anti-IL10). (I) Quantification of change in FDG uptake (SUV) calculated as change from baseline for each animal with detectable signal from spleen, nasal turbinates, and tonsils. Significance calculated by 2-way ANOVA and Tukey’s multiple comparison test.
Hogyan segíthetünk Önnek?
További termékinformációkért, vagy támogatásért keresse szakértőinket!
Vegye fel a kapcsolatot