Assessment of early-phase [18F]florbetaben images as a proxy for brain metabolism in mouse models of Alzheimer’s disease
2026.03.10.
Robin Gröger et al. Journal of Cerebral Blood Flow & Metabolism, 2026
Abstract
[18F]FDG–PET and β-amyloid-PET are established tools for assessing biomarker status in Alzheimer’s disease. In this study, the authors evaluated the potential of early-phase [18F]florbetaben (FBB) PET as a functional proxy for [18F]FDG–PET in preclinical Alzheimer’s disease models by examining regional perfusion and glucose metabolism in two transgenic mouse lines. Ninety-two APPPS1 (n = 17), APPSAA (n = 56), and age- and sex-matched wild-type mice (n = 19; 3–12 months, 40% female) underwent static [18F]FDG–PET (30–60 min p.i.) and dynamic [18F]FBB–PET (0–60 min p.i.). Standardized uptake values were derived for both [18F]FDG–PET and [18F]FBB–PET for the whole brain and 14 Ma–Benveniste–Mirrione atlas regions. The 1–3 min p.i. time window was identified as optimal, yielding the highest concordance with [18F]FDG (R = 0.53, p < 0.0001) across all regions. Both APPPS1 and APPSAA mice exhibited significant increases in perfusion (both p < 0.0001) and glucose metabolism (APPPS1: p = 0.0028; APPSAA: p < 0.0001) compared to wild-type controls. These findings demonstrate that early-phase [18F]FBB–PET not only mirrors [18F]FDG–PET-derived metabolic changes but also enables a single-scan assessment of β-amyloid pathology and brain function, thereby reducing the number of required scans and potentially the number of animals per study, and strengthening the translational value of preclinical PET research.
Results from nanoScan® PET/MRI
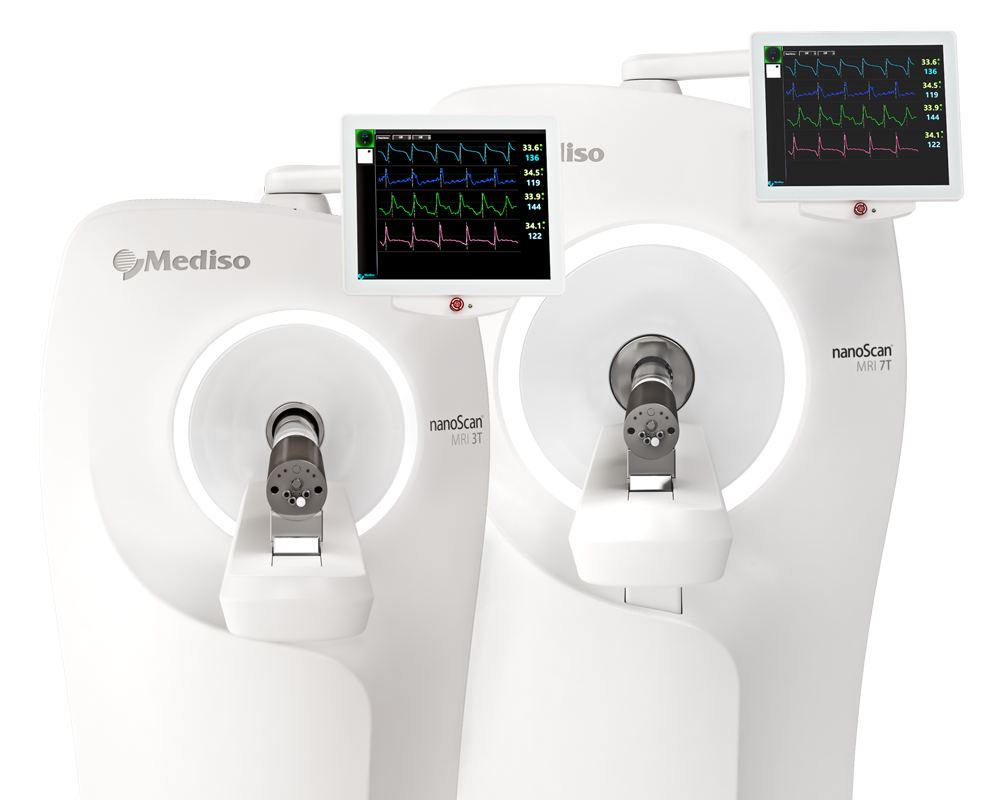
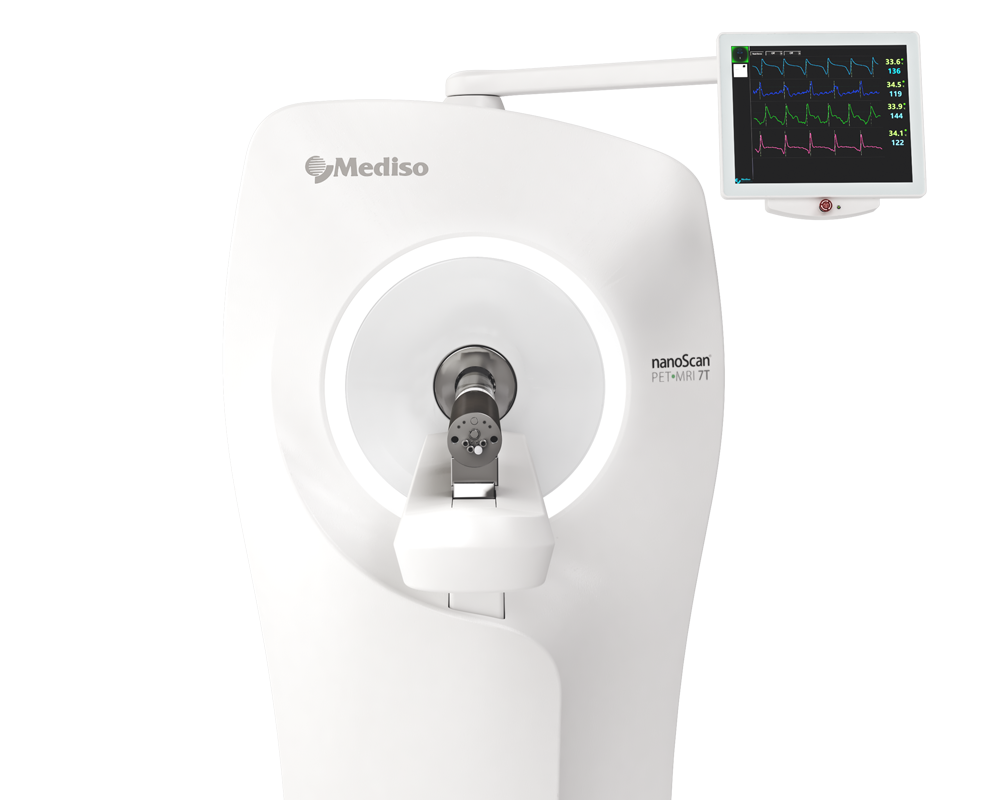
All mice were imaged with a 3 T Mediso nanoScan® PET/MR scanner (Mediso Medical Imaging Systems Ltd., Hungary) using a triple-mouse imaging chamber. Prior to [18F]FDG imaging, animals were fasted for at least 4 h to minimize baseline glucose levels. Two 2-min anatomical T1 MR scans (sagittal and axial) were performed before tracer injection and PET scan (head receive coil, matrix size 96 × 96 × 22 mm3, voxel size 0.24 × 0.24 × 0.80 mm3, repetition time 677 ms, echo time 28.56 ms, flip angle 90°).
Injected dose was 12.9 ± 2.2 MBq for [18F]FBB and 16.8 ± 3.1 MBq for [18F]FDG delivered in 200 μL saline via intravenous injection. [18F]FDG–PET data were acquired in a static 30–60 min p.i. window, whereas [18F]FBB–PET was recorded dynamically over a 0-60 min period. List-mode data within a 400-600 keV energy window were reconstructed using a 3D iterative algorithm (Tera-Tomo 3D, (Mediso Medical Imaging Systems Ltd., Hungary) with the following parameters: matrix size 55 × 62 × 187 mm3, voxel size 0.3 × 0.3 × 0.3 mm3, eight iterations, six subsets. Decay, random, and attenuation corrections were applied. The T1 image was used to create a body-air material map for the attenuation correction.
-
Early-phase [18F]florbetaben (FBB) PET images co-registered to MRI templates provided perfusion-related information, allowing anatomical localization and enabling region-based comparisons of perfusion and metabolism across the brain. Figure 1a shows averaged axial and coronal PET SUV maps projected onto a T1 MRI template, directly demonstrating PET/MRI co-registration. The combined PET/MRI framework enabled visualization of regional perfusion patterns and time-activity curves across the dynamic PET acquisition period, facilitating comparison between disease models and controls. Figure 1b displays whole-brain time-activity curves from dynamic FBB PET illustrating the rapid uptake peak within the first minutes, supporting selection of the optimal window.
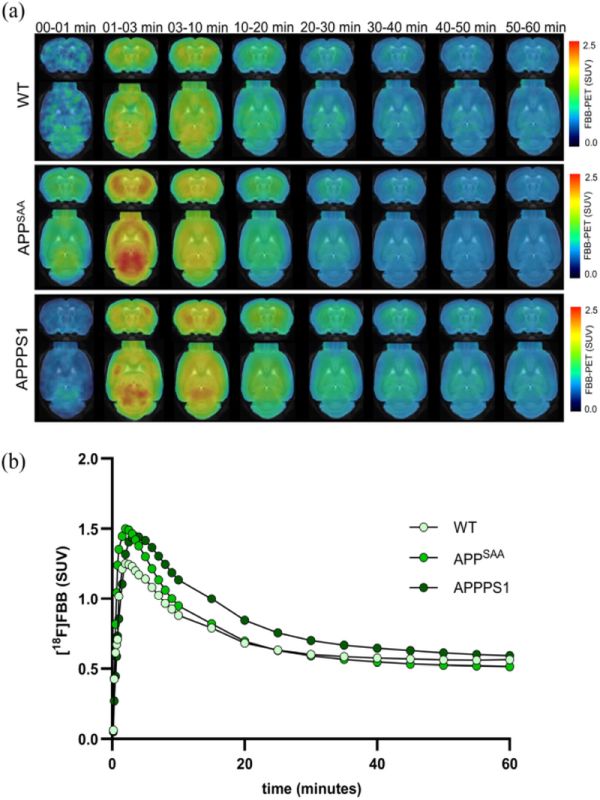

Figure 1.: Dynamic β-amyloid-PET imaging: (a) representative averaged axial and coronal [18F]FBB–PET SUV maps, (b) averaged time-activity curves of whole-brain of both mouse models.
- Both Alzheimer’s disease mouse models (APPPS1 and APPSAA) showed significantly increased cerebral perfusion in early-phase FBB PET compared with wild-type controls (p < 0.0001).
Early-phase FBB PET correlated with glucose metabolism measured by [18F]FDG PET across multiple brain regions. Figure 3 shows regional correlation plots between early-phase FBB and FDG uptakes in whole-brain and in three representative target regions (CTX: cortex; HIP: hippocampus; THA: thalamus).
Figure 3.: Comparison of cerebral perfusion and metabolism across AD mouse models: (a) averaged SUV-scaled axial and coronal maps, (b, c) dot plots represent group-wise comparisons.

-
These same mouse models also exhibited significantly increased glucose metabolism on FDG PET relative to controls (APPPS1: p = 0.0028; APPSAA: p < 0.0001), demonstrating consistent metabolic alterations measurable with PET imaging.
Overall, the results demonstrated that early-phase FBB PET integrated with MRI can act as a functional surrogate for FDG PET metabolism, supporting the feasibility of obtaining both amyloid pathology and functional perfusion information from a single PET/MRI session. This integrated approach is particularly valuable for longitudinal preclinical studies and enables a more precise phenotyping of disease models with fewer resources.
W czym możemy pomóc?
Skontaktuj się z nami aby uzyskać informacje techniczne i / lub wsparcie dotyczące naszych produktów i usług.
Napisz do nas