Acute transcutaneous auricular vagus nerve stimulation modulates presynaptic SV2A density in healthy rat brain: An in vivo microPET study
2024.10.20.
Karina H. Binda et al, Psychophysiology, 2024
Summary
Vagus nerve stimulation (VNS) is the subject of exploration as an adjunct treatment for neurological disorders such as epilepsy, chronic migraine, pain, and depression. A non-invasive form of VNS is transcutaneous auricular VNS (taVNS) and according to clinical and preclinical studies, it has similar effectiveness as VNS, but without its well-known risks and side effects. The aim of the current study was to revelal the mechanism of taVNS action by performing exploratory analyses to test the hypothesis that acute taVNS induces quantifiable changes in synaptic vesicle glycoprotein 2A (SV2A) as a marker of presynaptic density, and in cerebral glucose metabolism, imaged with [11C]UCB-J and [18F]FDG PET, respectively, in brain regions relevant to PD of healthy rats. PET scans were done on two separate days: (1) at baseline, and (2) after acute unilateral left taVNS or sham stimulation (30 min). Results show that taVNS reduced [11C]UCB-J binding in the frontal cortex, striatum and midbrain compared to baseline by a range of 36%–59%, an effect that was not observed in control sham-stimulated rats. The [18F]FDG PET uptake remained unchanged following acute taVNS or sham stimulation compared to baseline values.
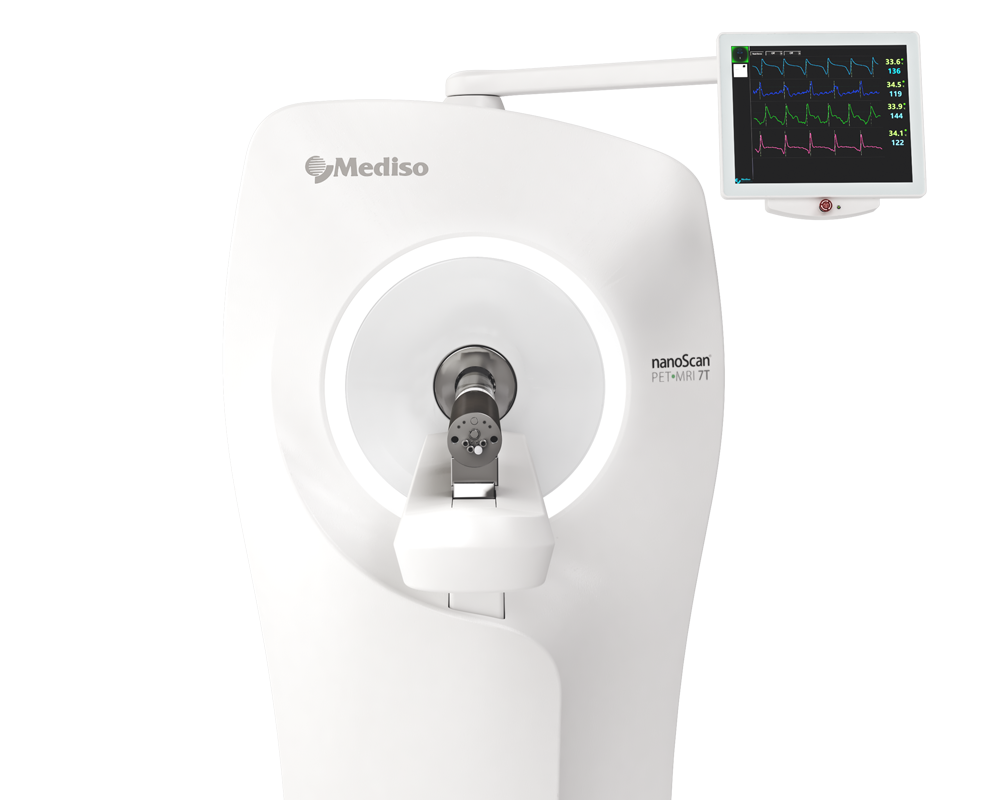
Results from nanoScan® PET/MRI
Female Sprague–Dawley rats were anesthetized with a combination of isoflurane and oxygen and underwent a single 30-min session of taVNS prior to the second PET session. For [11C]UCBJ, the stimulation started 30 min before the tracer injection and image acquisition. For [18F]FDG, first, the tracer was injected, and then 10 min later, we began the 30-min stimulation. The rats were then moved to the scanner and imaged for a 30-min period, which began at 45 min after tracer injection. Both radiotracers were administered via a tail vein catheter. The injected dose of [11C]UCB-J was 25±6 MBq, and of [18F]FDG was 24.4±5 MBq. Image acquisition of [11C]UCB-J began at tracer injection and lasted 90 min, while [18F]FDG began 45 min after tracer injection and lasted 30 min. The time-frame structure employed was: [11C]UCB-J of 8 × 15, 4 × 30, 2 × 60, 2 × 120; 4 × 300 and 6 × 600 s (total 26 frames, 90 min) and for [18F]FDG we acquired 1 frame of 30 min. For [11C]UCB-J analyses, kinetic modeling was performed using PMOD Kinetic Modeling Tool (PKIN). We used the 1-tissue-compartment (1T) model and we used the heart input function curve to estimate the values of the total volume of distribution (VT). For [18F]FDG analyses, we obtained the standardized uptake values (SUV) that depend on the regional radioactivity concentration (Bq/g), normalized to the injected dose (Bq) and corrected for the animal's weight (g). SUV data were normalized to the whole brain (wb) uptake (normalized SUV=SUVRegion/SUVWB).
Results show:
- taVNS reduced [11C]UCB-J binding in the frontal cortex, striatum and midbrain compared to baseline by a range of 36%–59%, an effect that was not observed in control sham-stimulated rats (Figure 3, 4).

Figure 3. Representative volume of distribution (VT) images of the frontal cortex (green), striatum (red), and midbrain (blue) (a) and of the time-activity curves (TAC) of [11C]UCB-J uptake in the left striatum at baseline (black) and after 30 min taVNS (red) (b).

Figure 4. The change in [11C]UCB-J binding between the post-taVNS or sham condition compared to baseline of the frontal cortex, striatum, and midbrain in the left (a) and right (b) hemispheres of healthy animals treated with taVNS or sham stimulation.
- No significant changes were observed in [18F]FDG SUV (Figure 5).

Figure 5. Representative SUV images of [18F]FDG uptake at baseline and after 30 min taVNS in the frontal cortex (green), striatum (red), and midbrain (blue) of healthy rats.
Here, 30 min of taVNS of the left ear is shown to be associated with modulation of [11C]UCB-J uptake in cortical and subcortical areas of the brain. The present study is the first to evaluate the in vivo effect of taVNS on synaptic SV2A density and glucose metabolism.
Full article on onlinelibrary.wiley.com
How can we help you?
Don't hesitate to contact us for technical information or to find out more about our products and services.
Get in touch