CD4 T cells are rapidly depleted from tuberculosis granulomas following acute SIV co-infection
2022.05.31.
Taylor W. Froman et al, Cell Reports, 2022
Summary
HIV/Mycobacterium tuberculosis (Mtb) co-infected individuals have an increased risk of tuberculosis prior to loss of peripheral CD4 T cells, raising the possibility that HIV co-infection leads to CD4 T cell depletion in lung tissue before it is evident in blood. Here, we use rhesus macaques to study the early effects of simian immunodeficiency virus (SIV) co-infection on pulmonary granulomas. Two weeks after SIV inoculation of Mtb-infected macaques, Mtb-specific CD4 T cells are dramatically depleted from granulomas, before CD4 T cell loss in blood, airways, and lymph nodes, or increases in bacterial loads or radiographic evidence of disease. Spatially, CD4 T cells are preferentially depleted from the granuloma core and cuff relative to B cell-rich regions. Moreover, live imaging of granuloma explants show that intralesional CD4 T cell motility is reduced after SIV co-infection. Thus, granuloma CD4 T cells may be decimated before many co-infected individuals experience the first symptoms of acute HIV infection.
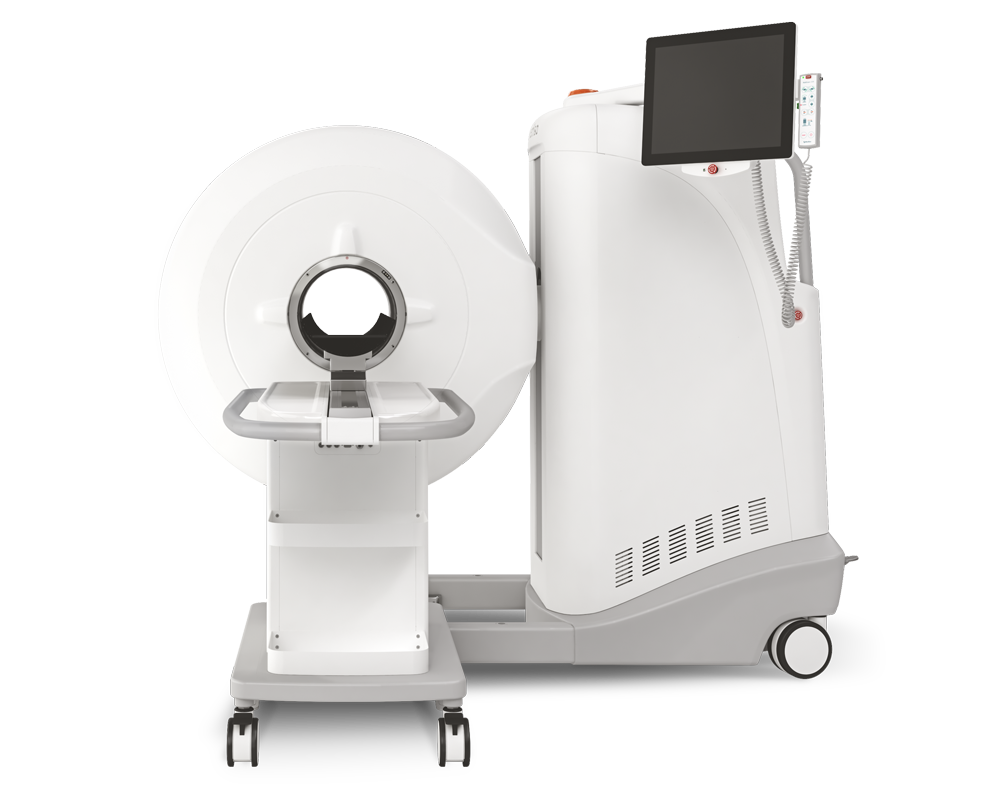
Results from MultiScan™ LFER PET/CT
- Authors did not observe clinically significant tuberculosis disease reactivation in the first 2 weeks after SIV infection
- There were no changes in the number of lesions that could be identified by PET-CT imaging after SIV infection
- no difference in granuloma size as measured by volume of abnormal voxels or density range after SIV infection (Fig 1H)
- no difference in glycolytic activity as measured by 18F-FDG uptake (Fig 1I)
- Mycobacterial loads in individual granulomas were significantly increased in the co-infected animals, but the difference was less than 2-fold (Fig1J)

Fig1, (A) Ten rhesus macaques were intrabronchially infected with Mycobacterium tuberculosis H37Rv for 10–11 weeks and five macaques were subsequently infected with SIVmac239 intravenously. Both groups were followed for another 14 days.(B) Acute viral infection was tracked by measuring plasma viral loads after co-infection. (C and D) (C) Example image of RNAscope staining for SIV viral RNA in a co-infected granuloma, including specific microanatomical regions within the granuloma. vRNA, red; counterstained nuclei, light blue. (D) Quantification of the number of SIV+ spots in uninvolved lung tissue (n = 14) and pulmonary lymph nodes (n = 11) compared with granulomas (n = 37). (E) Microanatomical regions of the granuloma were spatially characterized for different viral burdens. A total of 37 granulomas were analyzed containing 24 GrALT regions (F) Distribution violin plots of the size in μm2 of individual SIV+ spots with the frequency of >100 μm spots indicated above the boxed area in uninvolved lung (n = 5,567), lymph node (n = 28,447), and granuloma core (n = 7,789), cuff (n = 17,639), and GrALT (n = 3,304). (G) 18FDG PET-CT scans were performed immediately before SIV infection and at day 12 post co-infection, which allowed tracking of 102 visible lesions (n = 5–41 per animal that had detectable lesions).(H) The change in volume of each lesion as measured in voxels (0.5 mm3) with abnormal Hounsfeld unit density (−400 to 200 HU) on CT was insignificant from pre- to post-SIV infection.(I) 18FDG uptake, expressed as the total lesion glycolytic (TLG) activity in standardized uptake value/body weight (SUVbw)/mL, of each lesion was compared pre-to post-SIV infection.(J) Individual granulomas were isolated at the time of necropsy for determination of bacterial load (n = 2–24 per animal; see Figure S1G). (K) RNA isolated from each granuloma was assayed for viral quantification and compared with bacterial burden in 72 co-infected granulomas. Statistical analysis was calculated using (D and E) one-way ANOVA with Tukey correction for multiple comparisons, (H and I) Student’s unpaired t tests, (J) Mann-Whitney U test, or (K) nonlinear regression analysis. Ns, non-significant; ∗∗p < 0.01, ∗∗∗p < 0.001 ∗∗∗∗p < 0.0001. See also Figure S1.
How can we help you?
Don't hesitate to contact us for technical information or to find out more about our products and services.
Get in touch