A measles-vectored vaccine candidate expressing prefusion-stabilized SARS-CoV-2 spike protein brought to phase I/II clinical trials: protection of African green monkeys from COVID-19 disease
2024.04.02.
W. Paul Duprex et al., Journal of Virology, 2024
ABSTRACT
Severe acute respiratory syndrome coronavirus 2 (SARS-CoV-2) emerged at the end of 2019 and is responsible for the largest human pandemic in 100 years. Thirty-four vaccines are currently approved for use worldwide, and approximately 67% of the world population has received a complete primary series of one, yet countries are dealing with new waves of infections, variant viruses continue to emerge, and breakthrough infections are frequent secondary to waning immunity. Here, we evaluate a measles virus (MV)-vectored vaccine expressing a stabilized prefusion SARS-CoV-2 spike (S) protein (MV-ATU3-S2PΔF2A; V591) with demonstrated immunogenicity in mouse models (see companion article [J. Brunet, Z. Choucha, M. Gransagne, H. Tabbal, M.-W. Ku et al., J Virol 98:e01693-23, 2024, https://doi.org/10.1128/jvi.01693-23]) in an established African green monkey model of disease. Animals were vaccinated with V591 or the control vaccine (an equivalent MV-vectored vaccine with an irrelevant antigen) intramuscularly using a prime/boost schedule, followed by challenge with an early pandemic isolate of SARS-CoV-2 at 56 days post-vaccination. Pre-challenge, only V591-vaccinated animals developed S-specific antibodies that had virus-neutralizing activity as well as S-specific T cells. Following the challenge, V591-vaccinated animals had lower infectious virus and viral (v) RNA loads in mucosal secretions and stopped shedding virus in these secretions earlier. vRNA loads were lower in these animals in respiratory and gastrointestinal tract tissues at necropsy. This correlated with a lower disease burden in the lungs as quantified by PET/CT at early and late time points post-challenge and by pathological analysis at necropsy.
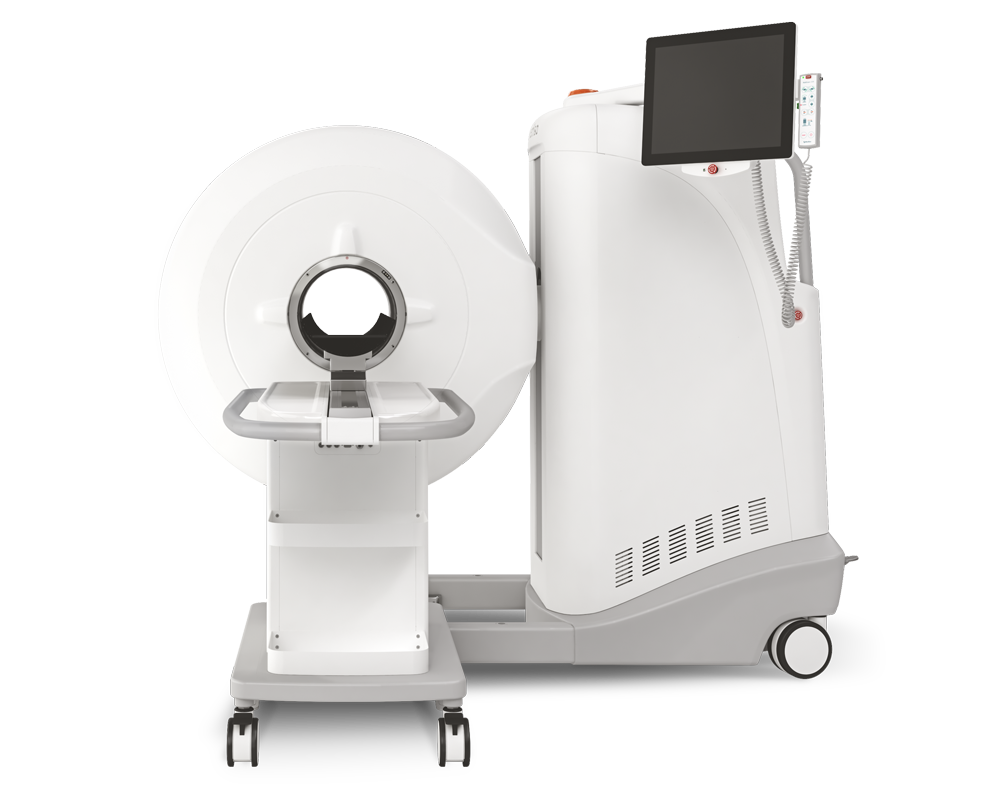
Results from MultiScan™ LFER PET/CT
- All animals were imaged at an early (3 or 4 d.p.c.) and late (10 or 11 d.p.c.) time point
- First, the CT images were analyzed alone, and the seven lung lobes of each animal were given a disease CT score (see table in publication)
- Collectively, the 18F-FDG uptake was lower in the V591-vaccinated animals at the early time point
- No clear differences between the V591-vaccinated and control animals in standard uptake values of 18F-FDG for thoracic lymph nodes

Fig 6. Positron emission tomography (PET)/computed tomography (CT) imaging of SARS-CoV-2 challenged AGMs. (A) and (B) Region-of-interest analysis on PET images of animals challenged with SARS-CoV-2. Total lung inflammation (A) measured by total 18F-fluoro-2-deoxy-D-glucose (18F-FDG) uptake in standard uptake values (SUV) at early and late days post-challenge (d.p.c.; 3 and 10 d.p.c. for animals 04–09 or 4 and 11 d.p.c. for animals 01–03 and 10–12). Horizontal lines represent the mean total SUV for each group. (B) Representative PET/CT scans collected at early and late d.p.c. (as above). Each time point for each animal depicts an axial (left) and coronal (right) section. Symbols *, #, and ‡ denote the same scans at higher magnification in the larger right panels. Yellow arrows/dotted lines indicate 18F-FDG uptake. Representative scans shown in the larger right panels depict no 18F-FDG uptake (−), minimal 18F-FDG uptake (+), and extensive 18F-FDG uptake (+++). A representative PET color scale depicting 0–15 SUV is shown on the far right. (C and D) Estimation of inflammation in individual lymph nodes for each animal over time by measuring 18F-FDG uptake of each lymph node in SUV. Data have been split into V591-vaccinated (C) and control (D) groups for clarity. Symbols (A, C, and D) as for Fig. 1. (A–D) V591-vaccinated, red; control-vaccinated, black.
How can we help you?
Don't hesitate to contact us for technical information or to find out more about our products and services.
Get in touch